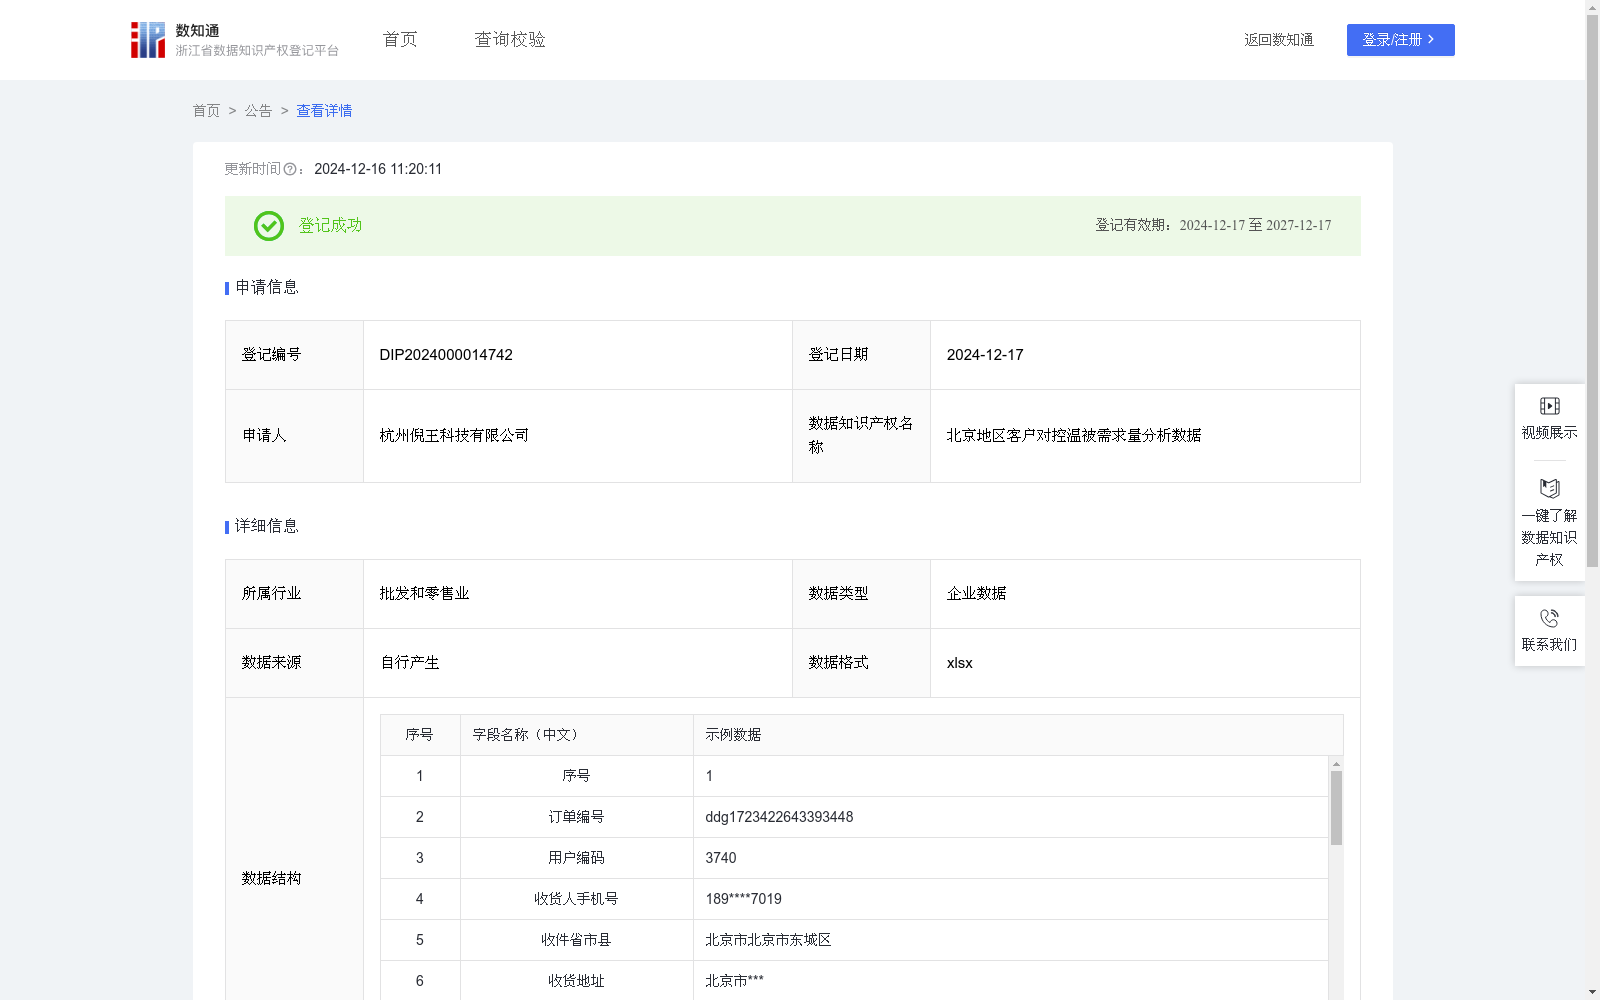
北京地区客户对控温被需求量分析数据
收藏资源简介:
通过收集和分析北京客户关于控温被的消费相关数据,了解客户对控温被的购买力水平和消费偏好,从而了解该产品在该区域是否畅销,了解区域内关于产品的消费需求状况,从而为本行业的所有企业制定生产策略,更好地为用户提供个性化的商品和服务。控温被整体销售受地域气温影响,所以数据应用场景及算法进行分区域研究。1.数据采集:采集收货地为北京的客户关于控温被的相关交易数据。2.数据处理:对采集到数据进行分类、合并、累加,便于分析使用。3.算法加工:将处理后的数据进行需求量分析:P={a1(单笔最少订单数量)/b1(单笔最少消费额度)+a2(单笔最高订单数量)/b2(单笔最高消费额度)+a3(平均订单数量)/b3(平均消费额度)}*k,k为消费系数,不同省份系数大小值不同,按经验取值k值为33。4、数据分类分级:根据计算出的需求量水平,将客户需求等级划分为“高、中、低”不同的类别和级别(10分以上标记为“高需求等级”,5-10分区间内标记为“中需求等级”,5分以下标记为“低需求等级”),计算高需求等级客户数量占比=(高需求等级客户数量/客户总数)x100%,当占比≥50%时,城市消费评价记为“优异”,占比<50%则城市消费评价记为“一般”,加大对于“优异”消费城市的供货数量及相关销售政策,保持“一般”销售城市的铺货情况,持续观察该区域的销售情况。
To understand the purchasing power and consumption preferences of customers for temperature-regulating blankets, as well as the product's market popularity and local consumption demand in the Beijing area, this dataset is collected and analyzed to help enterprises in the industry formulate production strategies and provide personalized products and services for users. Since the overall sales of temperature-regulating blankets are affected by regional temperatures, data application scenarios and algorithms will be studied on a regional basis. 1. Data Collection: Collect transaction data related to temperature-regulating blankets from customers whose delivery address is in Beijing. 2. Data Processing: Classify, merge and accumulate the collected data to facilitate subsequent analysis. 3. Algorithm Processing: Conduct demand analysis on the processed data using the formula: P = {a1 (minimum single-order quantity)/b1 (minimum single-order consumption amount) + a2 (maximum single-order quantity)/b2 (maximum single-order consumption amount) + a3 (average single-order quantity)/b3 (average single-order consumption amount)} * k, where k is the consumption coefficient that varies across provinces, and the empirical value of k is 33. 4. Data Classification and Grading: Divide customer demand levels into three categories: "high", "medium" and "low" based on the calculated demand level (marked as "high demand level" for scores above 10, "medium demand level" for scores in the range of 5 to 10, and "low demand level" for scores below 5). Calculate the proportion of high-demand-level customers = (number of high-demand-level customers / total number of customers) × 100%. When the proportion is ≥ 50%, the urban consumption evaluation is recorded as "Excellent"; when the proportion is < 50%, it is recorded as "General". Increase the supply quantity and relevant sales policies for "Excellent" consumption cities, maintain the product distribution status for "General" sales cities, and continuously monitor the sales situation in this region.