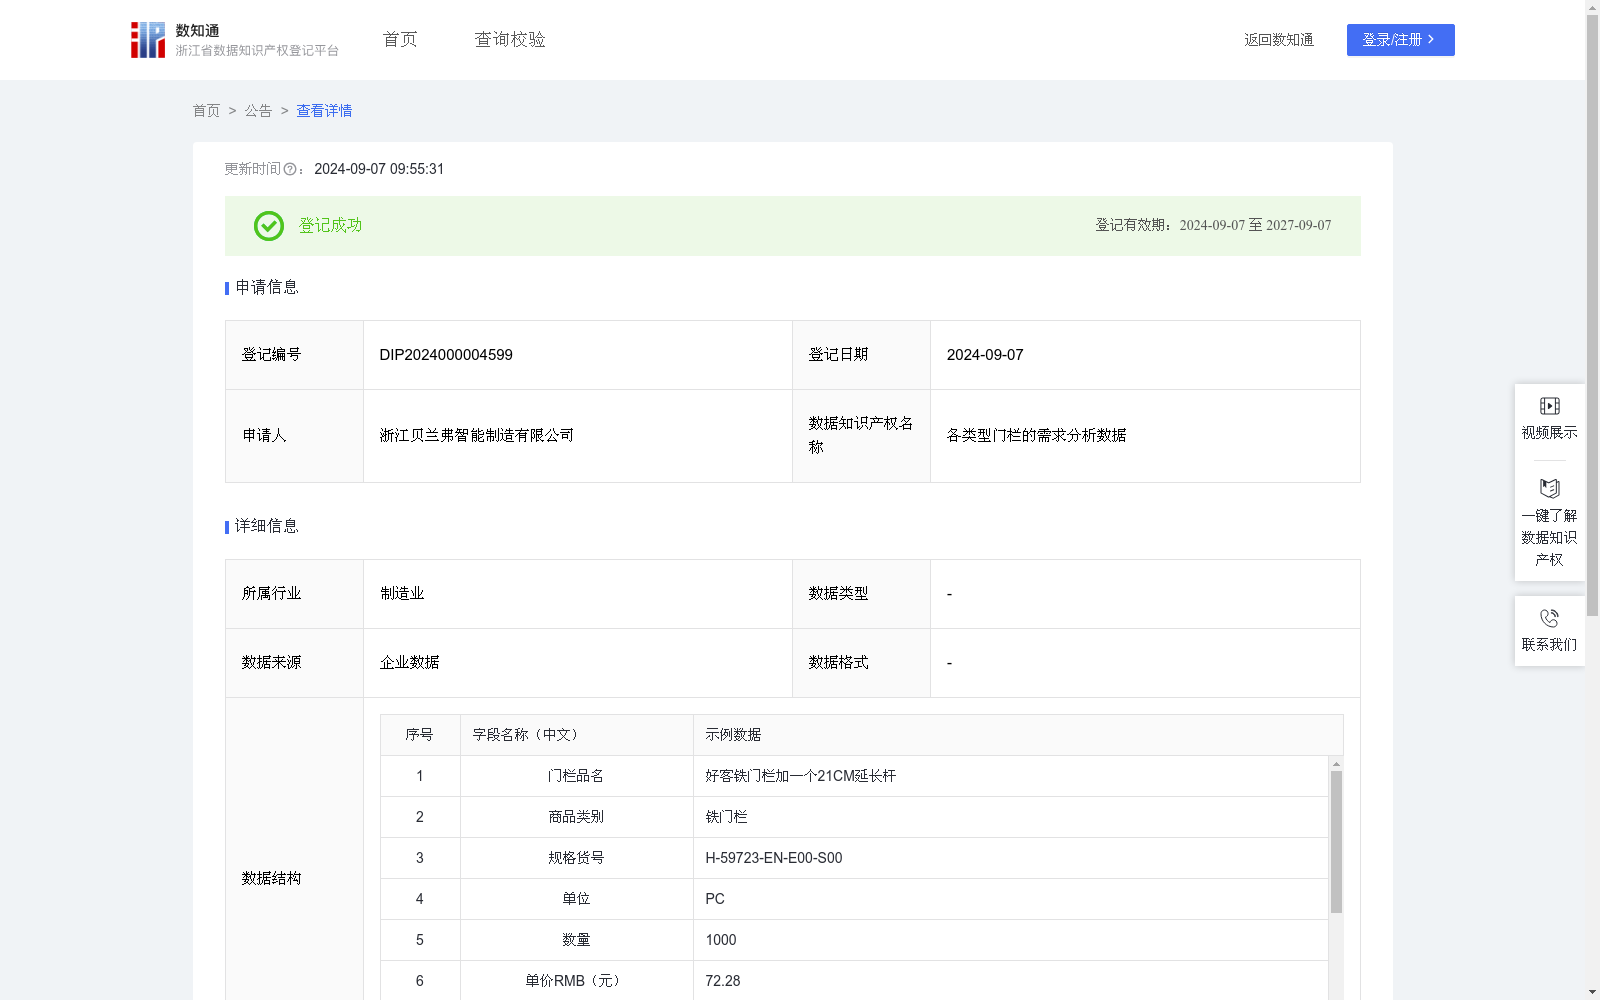
各类型门栏的需求分析数据
收藏资源简介:
通过收集和分析客户对不同类型门栏的消费相关数据,了解客户对门栏的购买力水平和消费偏好,从而了解该产品的需求级别,为本行业的所有企业制定生产计划提供数据支持,做到供需平衡,帮助各企业制定更有针对性的销售策略。1、统计分析各类门栏产品的销售额、单价、各类别销售总额、总销售额等情况,2、销售额=单价RMB*数量,运用SUMIF函数对同一类别商品销售额相加,得到同一类别商品销售总额,运用SUM函数对统计范围内的所有销售额相加,得到总销售额,同一类别商品销售总额占总销售额占比=同一类别商品销售总额/总销售额*100%,3、同一类别商品销售总额占总销售额占比按从大到小进行排名;占比前三名的商品类型需求级别为“高”占比第4-10名的商品类型需求级别为“中”,占比第11名及以后的商品类型需求级别为“低”。
This dataset is developed by collecting and analyzing customer consumption-related data for various types of gates. Its core objectives are as follows: to understand customers' purchasing power and consumption preferences towards gates, thereby determining the demand level of this product category; to provide data support for all enterprises in the industry to formulate production plans and achieve supply-demand balance; and to help enterprises develop more targeted sales strategies. 1. Conduct statistical analysis on key metrics of various gate products, including individual product sales revenue, unit price, total sales revenue of each product category, and overall total sales revenue. 2. The calculation formula for individual product sales revenue is: Sales Revenue = Unit Price (RMB) × Quantity. The SUMIF function is applied to sum the sales revenue of products belonging to the same category, obtaining the total sales revenue of the specific product category; the SUM function is used to sum all sales revenue within the statistical scope to get the overall total sales revenue. The proportion of a product category's total sales revenue in the overall total sales revenue is calculated as: (Total Sales Revenue of the Category / Overall Total Sales Revenue) × 100%. 3. Rank the total sales revenue proportions of all product categories in descending order. Set the demand level as "High" for the top 3 product types, "Medium" for those ranked 4th to 10th, and "Low" for product types ranked 11th and below.