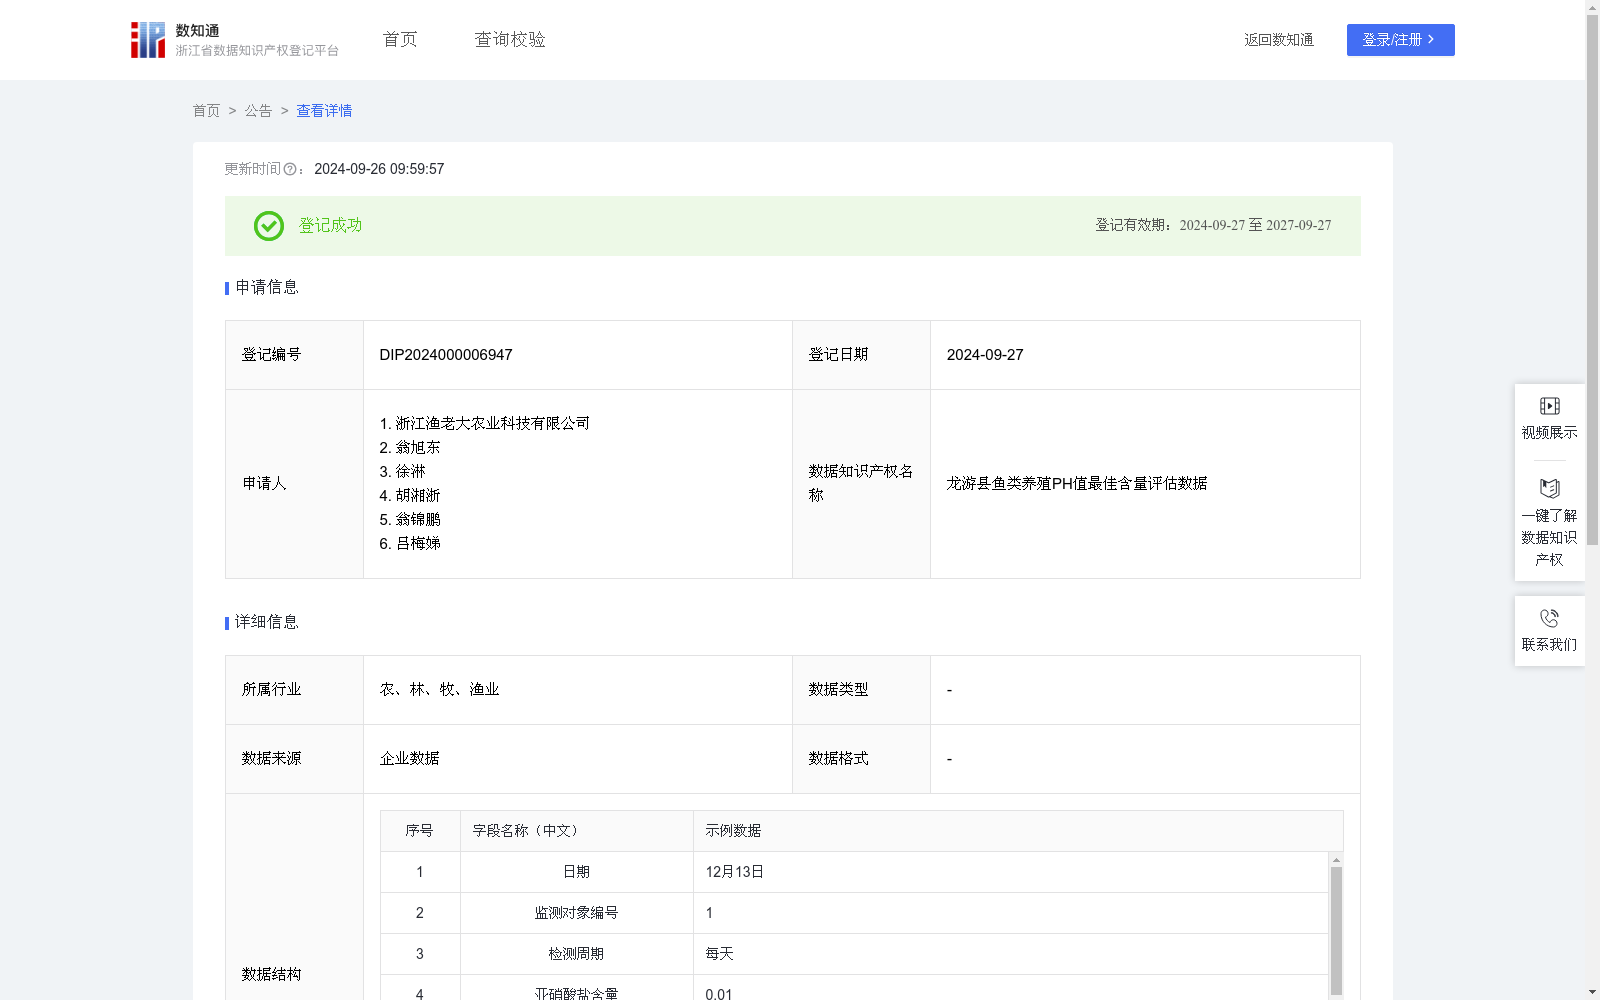
龙游县鱼类养殖PH值最佳含量评估数据
收藏资源简介:
将采集到的数据用来整理分析鱼苗养殖过程中的最佳PH值。在检测周期等数据为固定量条件下,调整养殖端PH值,监测品质优化情形下数据的变化,以研究优化品质时的PH值数值,从而优化养殖方式,改进养殖环境方法,同时可将优化经验应用于外部环境,形成鱼类养殖环境的多维度感知与控制,促进养殖产业向科学、高效、模式可移植的方向发展。为广大的鱼类养殖企业提高了产品质量和生产效率提供技术支持。将采集到的数据使用离散性模型用来预测鱼类养殖的最佳PH值。该模型在检测周期,养殖环境内氨氮含量,亚硝酸盐含量,溶解氧,温度等数据为固定数值范围的条件下,收集数据整理分析监测对象所处环境PH值,利用STDEV.P方程,计算PH值实际数值与初始数值之间的差分。STDEV.P=初始数值/实际数值,记录数据离散情况,对比离散程度不同时,鱼类整体品质的变化,品种外观评估提升则记为﹢,下降记为-;品种口味评估提升则记为﹢,下降记为-;将两项整合,出现共同提升则整体品质评估记为“↑”,共同下降则整体品质评估记为“↓”,出现一上升一下降情形时,整体品质评估记为“/"。通过收集PH值数据及其离散情况对整体品质的影响,确认鱼类养殖提质情形下PH值的最佳数据范围,反推生产政策,从而为鱼类养殖乃至水产养殖等其他行业提供品质优化的技术数据支持。
The collected data is used to organize and analyze the optimal pH value during fish fry breeding. Under the condition that fixed parameters such as detection cycle are controlled, the pH value in the breeding system is adjusted, and the data changes under the scenario of quality optimization are monitored to study the optimal pH value for quality improvement. This helps optimize breeding methods and improve aquaculture environment management. Furthermore, the optimized experience can be applied to external environments, enabling multi-dimensional perception and control of fish farming environments, and promoting the development of the aquaculture industry towards scientific, efficient, and mode-transplantable directions. It provides technical support for fish farming enterprises to improve product quality and production efficiency. The collected data is utilized with a dispersion model to predict the optimal pH value for fish farming. Under the condition that parameters such as detection cycle, ammonia nitrogen content, nitrite content, dissolved oxygen, and temperature in the aquaculture environment are within fixed numerical ranges, this model collects and analyzes the pH value of the monitored environment. It uses the STDEV.P equation to calculate the difference between the actual pH value and the initial value, where STDEV.P = Initial Value / Actual Value, and records the data dispersion. The changes in the overall quality of fish under different dispersion levels are compared: an improvement in the appearance evaluation of the fish variety is marked as +, and a decline is marked as -; similarly, an improvement in the taste evaluation is marked as +, and a decline is marked as -. The two indicators are integrated: if both improve, the overall quality assessment is marked as "↑"; if both decline, it is marked as "↓"; if one improves while the other declines, the overall quality assessment is marked as "/". By collecting the impact of pH data and its dispersion on overall fish quality, the optimal pH range for improving fish farming quality is determined, and production strategies are inversely deduced. This provides technical data support for quality optimization in fish farming and even other aquaculture-related industries.