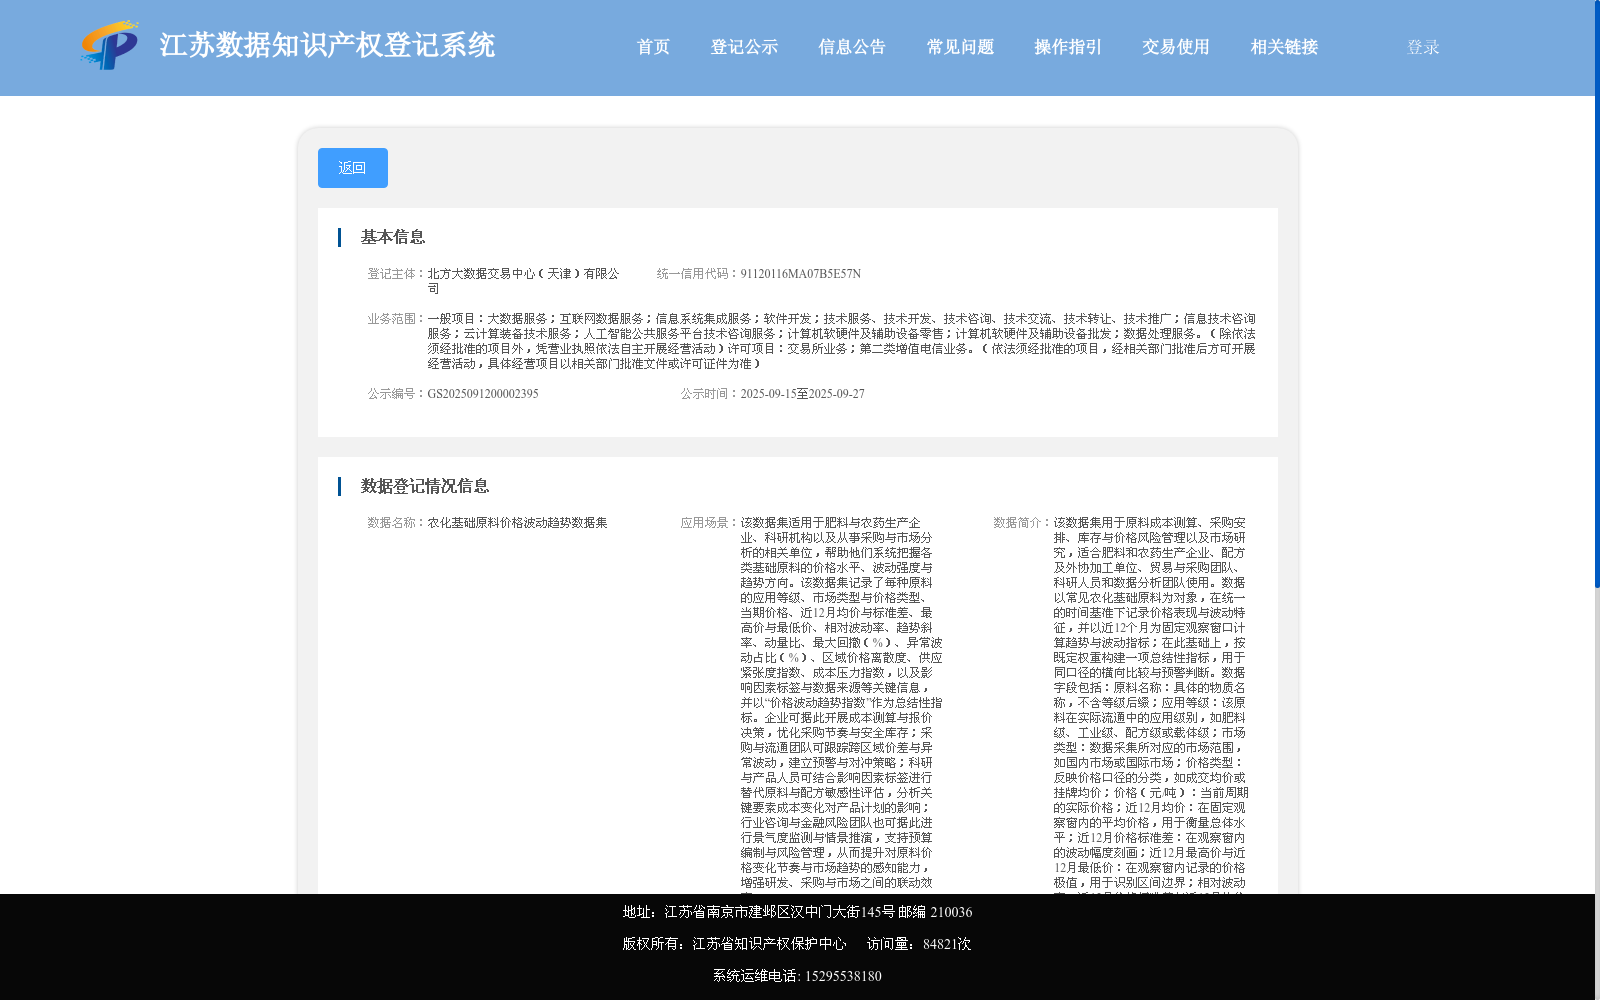
农化基础原料价格波动趋势数据集
收藏资源简介:
该数据集用于原料成本测算、采购安排、库存与价格风险管理以及市场研究,适合肥料和农药生产企业、配方及外协加工单位、贸易与采购团队、科研人员和数据分析团队使用。数据以常见农化基础原料为对象,在统一的时间基准下记录价格表现与波动特征,并以近12个月为固定观察窗口计算趋势与波动指标;在此基础上,按既定权重构建一项总结性指标,用于同口径的横向比较与预警判断。数据字段包括:原料名称:具体的物质名称,不含等级后缀;应用等级:该原料在实际流通中的应用级别,如肥料级、工业级、配方级或载体级;市场类型:数据采集所对应的市场范围,如国内市场或国际市场;价格类型:反映价格口径的分类,如成交均价或挂牌均价;价格(元/吨):当前周期的实际价格;近12月均价:在固定观察窗内的平均价格,用于衡量总体水平;近12月价格标准差:在观察窗内的波动幅度刻画;近12月最高价与近12月最低价:在观察窗内记录的价格极值,用于识别区间边界;相对波动率:近12月价格标准差与近12月均价之比,反映单位水平下的波动强度;趋势斜率:近12月价格对时间进行最小二乘回归得到的斜率,并用于与均价的比值进入总结性指标计算;动量比:近3月均价与近12月均价之差的比例化表达,用于刻画近期相对强弱;最大回撤(%):观察窗内从局部高点至随后低点的最大跌幅比例,用于识别下行风险暴露;异常波动占比(%):观察窗内环比变动超过预设阈值的期数占比,用于识别不稳定区段;区域价格离散度:当期不同区域均价的标准差与均值之比,用于衡量空间分布差异;供应紧张度指数:需求与供应的相对偏离度量,常以需求与供应的比值经归一处理获得;成本压力指数:上游能源、关键原料与运费等要素成本的综合变动强度,经归一处理后用于传导评估;影响因素标签:对价格的主要驱动进行结构化标注,如国际原油、天然气、运输成本、装置检修、季节性需求、汇率波动等;数据来源:标明公开市场、行业报告、企业报价或第三方数据服务商等具体来源;价格波动趋势指数:基于趋势斜率与均价之比、动量比、相对波动率、最大回撤、异常波动占比、区域价格离散度、供应紧张度指数与成本压力指数等多项分量经标准化与加权计算得到的综合性指标,用于在同一时间口径下对不同原料与不同应用等级的价格波动与趋势进行定量比较。通过上述结构化信息,使用者可以在价格水平、波动强度与趋势方向三个层面形成一致口径的判断,从而支撑成本预算、采购与库存策略、替代原料论证、跨区域价差分析以及异常波动预警等具体工作。
This dataset is designed for raw material cost calculation, procurement arrangement, inventory and price risk management, as well as market research, and is suitable for fertilizer and pesticide manufacturers, formula and outsourcing processing units, trade and procurement teams, researchers and data analysis teams. The dataset targets common basic agrochemical raw materials, and records their price performance and volatility characteristics under a unified time benchmark. A fixed observation window of the latest 12 months is adopted to calculate trend and volatility indicators. On this basis, a comprehensive summary indicator is constructed with preset weights for standardized cross-sectional comparison and early warning judgment. The data fields include: 'Raw Material Name': Specific name of the substance, without grade suffixes; 'Application Grade': The application level of the raw material in actual circulation, such as fertilizer grade, industrial grade, formula grade or carrier grade; 'Market Type': The market scope corresponding to data collection, such as domestic market or international market; 'Price Type': Classification reflecting price caliber, such as transaction average price or listed average price; 'Price (yuan/ton)': The actual price of the current cycle; '12-Month Average Price': The average price within the fixed observation window, used to measure the overall price level; '12-Month Price Standard Deviation': Characterization of volatility amplitude within the observation window; '12-Month Highest Price and 12-Month Lowest Price': The price extremes recorded within the observation window, used to identify price range boundaries; 'Relative Volatility': The ratio of the 12-month price standard deviation to the 12-month average price, reflecting the volatility intensity per unit price level; 'Trend Slope': The slope obtained by ordinary least squares regression of the 12-month prices against time, and the ratio of this slope to the average price is used in the calculation of the summary indicator; 'Momentum Ratio': A proportional expression of the difference between the 3-month average price and the 12-month average price, used to characterize the recent relative strength; 'Maximum Drawdown (%)': The maximum decline ratio from a local high to the subsequent low within the observation window, used to identify downside risk exposure; 'Abnormal Volatility Ratio (%)': The ratio of the number of periods with month-on-month changes exceeding a preset threshold within the observation window, used to identify unstable segments; 'Regional Price Dispersion': The ratio of the standard deviation to the mean of average prices in different regions in the current period, used to measure spatial distribution differences; 'Supply Tension Index': A relative deviation measure of demand and supply, usually obtained by normalizing the ratio of demand to supply; 'Cost Pressure Index': The comprehensive change intensity of factor costs such as upstream energy, key raw materials and freight, which is normalized for transmission assessment; 'Influencing Factor Tags': Structured annotations of the main drivers of price changes, such as international crude oil, natural gas, transportation costs, plant maintenance, seasonal demand, exchange rate fluctuations, etc.; 'Data Source': Specific sources such as public markets, industry reports, enterprise quotations or third-party data service providers; 'Price Fluctuation Trend Index': A comprehensive indicator calculated by standardizing and weighting multiple components including trend slope and average price ratio, momentum ratio, relative volatility, maximum drawdown, abnormal volatility ratio, regional price dispersion, supply tension index and cost pressure index. It is used for quantitative comparison of price fluctuations and trends of different raw materials and different application grades under the same time caliber. Through the above structured information, users can form standardized judgments on three dimensions: price level, volatility intensity and trend direction, thereby supporting specific tasks such as cost budgeting, procurement and inventory strategies, alternative raw material demonstration, cross-regional price difference analysis and abnormal fluctuation early warning.