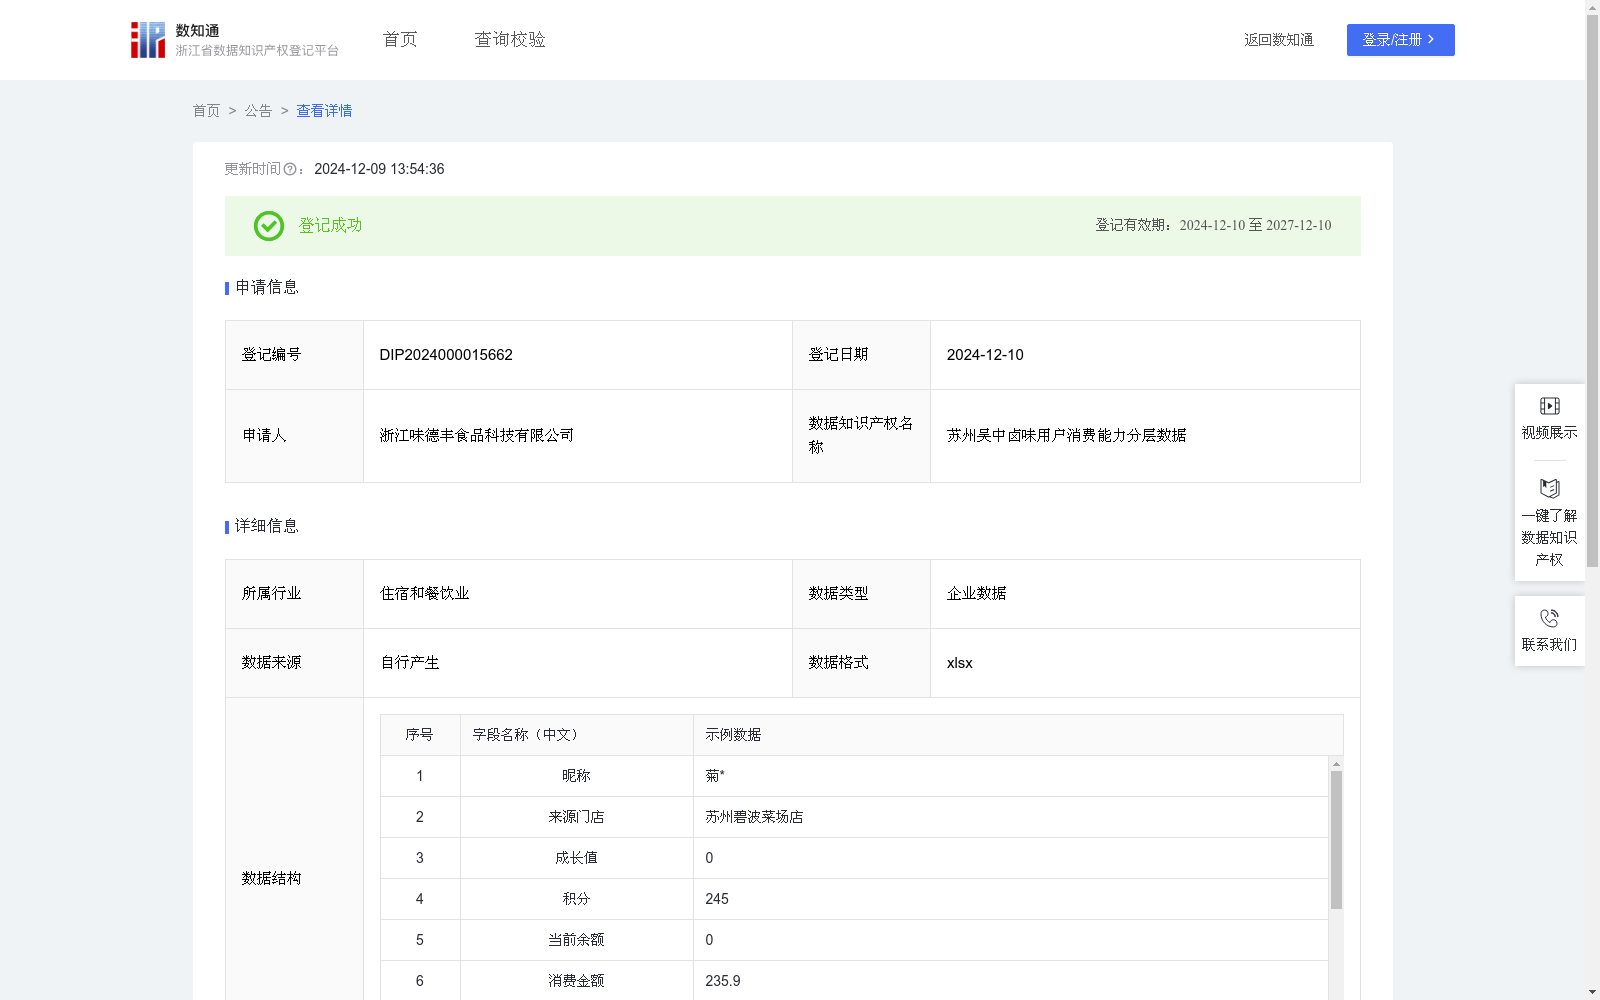
苏州吴中卤味用户消费能力分层数据
收藏资源简介:
企业在面对客户定制某些运营、营销策略时,希望能够针对不同的客户推行不同的策略,实现精准化运营。精准化运营的前提是客户关系管理,而客户关系管理的核心是客户价值管理。通过对各地区客户价值管理,满足不同价值客户的个性化需求。对于门店所在地区乃至整个长三角地区的卤味零售行业用户消费能力洞察具有一定参考价值。1、数据处理:对采集到的数据进行降噪、清洗、脱敏、聚集、分析。 2、数据加工:运用RFM模型提取出客户最近一次活动R(天数)、活动频率F(消费次数)、消费金额M(总额),将用户按照最近一次消费次数(R)进行分类,最近一次活动时间间隔长短对用户进行降序分类。按照从1-5评分,前20%的客户获得5分,下一级的20%用户获得4分,再下一级20%的客户为3分,再下一级20%的客户为2分,最后20%的客户为1分。根据客户活动频率(F)从高到底依次对用户进行分类,前20%的客户在用户活动频率的分数为5,以此类推。消费金额(M),前20%的客户在消费金额的分数为5,以此类推。消费金额最少的20%客户则分数为1。RFM得分=(R)得分*0.3+(F)得分*0.3+(M)得分*0.4评分大于等于4分的为A级客户,大于等于3小于4的为B级客户,大于等于2小于3的为C级客户,低于2的为D级客户。 3、通过对客户的分级管理,为不同价值类型的客户个性化服务提供数据支持。
When enterprises develop customized operational and marketing strategies for clients, they intend to implement differentiated strategies for different customers to realize precision operations. The prerequisite of precision operations is Customer Relationship Management (CRM), whose core is customer value management. By managing customer value across different regions, personalized demands of customers with varying value levels can be met. This dataset offers certain reference value for insights into the consumption capacity of users in the braised food retail industry within the region where the stores are located, as well as the entire Yangtze River Delta region. 1. Data Processing: Noise reduction, cleaning, data anonymization, aggregation and analysis are performed on the collected raw data. 2. Data Processing & Enrichment: The RFM model is utilized to extract three key metrics: Recency (R, days since last customer activity), Frequency (F, number of consumption times) and Monetary value (M, total consumption amount). Firstly, users are sorted in descending order according to the time interval since their last activity (R metric), and scored from 1 to 5: the top 20% of users receive a score of 5, the next 20% get 4, the subsequent 20% get 3, the following 20% get 2, and the last 20% get 1. Secondly, users are sorted in descending order based on their activity frequency (F metric), with the top 20% awarded a score of 5, and the rest graded following the same rule. Thirdly, users are sorted in descending order based on their total consumption amount (M metric), where the top 20% get a score of 5 and the bottom 20% get a score of 1. The final RFM score is calculated as: RFM Score = 0.3 * Recency Score + 0.3 * Frequency Score + 0.4 * Monetary Score. Customers are classified according to their RFM scores: Grade A customers (score ≥ 4), Grade B customers (3 ≤ score < 4), Grade C customers (2 ≤ score < 3), and Grade D customers (score < 2). 3. Hierarchical Customer Management: This customer classification provides data support for delivering personalized services to customers of different value tiers.