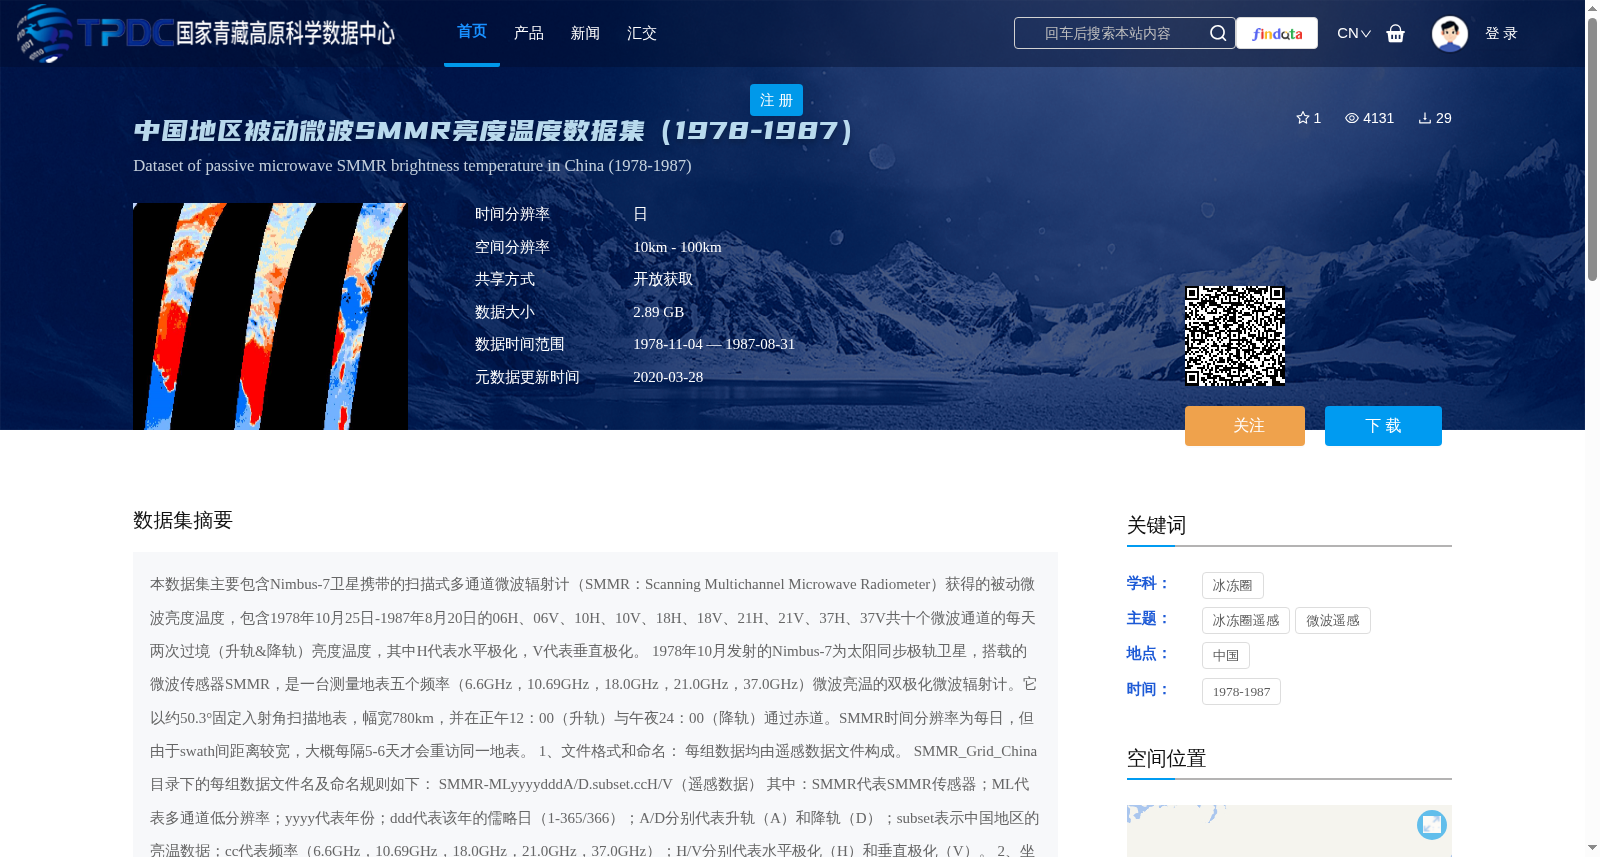
中国地区被动微波SMMR亮度温度数据集(1978-1987)
收藏资源简介:
本数据集主要包含Nimbus-7卫星携带的扫描式多通道微波辐射计(SMMR:Scanning Multichannel Microwave Radiometer)获得的被动微波亮度温度,包含1978年10月25日-1987年8月20日的06H、06V、10H、10V、18H、18V、21H、21V、37H、37V共十个微波通道的每天两次过境(升轨&降轨)亮度温度,其中H代表水平极化,V代表垂直极化。 1978年10月发射的Nimbus-7为太阳同步极轨卫星,搭载的微波传感器SMMR,是一台测量地表五个频率(6.6GHz,10.69GHz,18.0GHz,21.0GHz,37.0GHz)微波亮温的双极化微波辐射计。它以约50.3°固定入射角扫描地表,幅宽780km,并在正午12:00(升轨)与午夜24:00(降轨)通过赤道。SMMR时间分辨率为每日,但由于swath间距离较宽,大概每隔5-6天才会重访同一地表。 1、文件格式和命名: 每组数据均由遥感数据文件构成。 SMMR_Grid_China目录下的每组数据文件名及命名规则如下: SMMR-MLyyyydddA/D.subset.ccH/V(遥感数据) 其中:SMMR代表SMMR传感器;ML代表多通道低分辨率;yyyy代表年份;ddd代表该年的儒略日(1-365/366);A/D分别代表升轨(A)和降轨(D);subset表示中国地区的亮温数据;cc代表频率(6.6GHz,10.69GHz,18.0GHz,21.0GHz,37.0GHz);H/V分别代表水平极化(H)和垂直极化(V)。 2、坐标系及投影: 投影方式为等积割圆柱投影,双标准纬线为南北纬30度。有关EASE-GRID的相关详细信息,请参考http://www.ncgia.ucsb.edu/globalgrids-book/ease_grid/。 如果需要将EASE-Grid投影方式转换成Geographic投影方式,请参照ease2geo.prj文件,内容如下: Input projection cylindrical units meters parameters 6371228 6371228 1 /* Enter projection type (1, 2, or 3) 0 00 00 /* Longitude of central meridian 30 00 00 /* Latitude of standard parallel Output Projection GEOGRAPHIC Spheroid KRASovsky Units dd parameters end 3、数据格式: 以整数形二进制存储,每个数据占2个字节。本数据集中实际存储的数据为亮温*10,读出数据后需除以10得到真实亮温。 空间分辨率:25km; 时间分辨率:逐日,从1978年至1987年。 4、空间范围: 经度:60.1°-140.0°东经; 纬度:14.9°-55.0°北纬。 5、数据读取 每一组数据的遥感影像数据文件可以在ENVI和ERDAS软件中打开。
This dataset primarily contains passive microwave brightness temperatures acquired by the Scanning Multichannel Microwave Radiometer (SMMR) onboard the Nimbus-7 satellite. The data includes brightness temperatures from two daily overpasses (ascending and descending orbits) across 10 microwave channels: 06H, 06V, 10H, 10V, 18H, 18V, 21H, 21V, 37H, and 37V, from October 25, 1978 to August 20, 1987, where H represents horizontal polarization and V represents vertical polarization. Launched in October 1978, Nimbus-7 is a Sun-synchronous polar-orbiting satellite. Its onboard SMMR is a dual-polarization microwave radiometer that measures microwave brightness temperatures at five surface frequencies: 6.6 GHz, 10.69 GHz, 18.0 GHz, 21.0 GHz, and 37.0 GHz. It scans the surface at a fixed incidence angle of approximately 50.3°, with a swath width of 780 km, and crosses the equator at approximately 12:00 noon (ascending orbit) and 24:00 midnight (descending orbit). The temporal resolution of SMMR is daily, but due to the wide spacing between swaths, it revisits the same surface approximately every 5-6 days. 1. File Format and Naming: Each dataset consists of remote sensing data files. The naming convention for datasets under the SMMR_Grid_China directory is as follows: SMMR-MLyyyydddA/D.subset.ccH/V (remote sensing data) Where: SMMR represents the SMMR sensor; ML stands for multi-channel low-resolution; yyyy is the 4-digit year; ddd is the Julian day of the year (1-365/366); A/D represent ascending (A) and descending (D) orbits respectively; subset indicates brightness temperature data for the Chinese region; cc represents the frequency band (6.6 GHz, 10.69 GHz, 18.0 GHz, 21.0 GHz, 37.0 GHz); H/V represent horizontal polarization (H) and vertical polarization (V) respectively. 2. Coordinate System and Projection: The projection uses the equal-area cylindrical secant projection, with two standard parallels at 30° north and south latitudes. For detailed information about EASE-GRID, please refer to http://www.ncgia.ucsb.edu/globalgrids-book/ease_grid/. If you need to convert the EASE-Grid projection to Geographic projection, please refer to the ease2geo.prj file, the content of which is as follows: Input projection cylindrical units meters parameters 6371228 6371228 1 /* Enter projection type (1, 2, or 3) 0 00 00 /* Longitude of central meridian 30 00 00 /* Latitude of standard parallel Output Projection GEOGRAPHIC Spheroid KRASovsky Units dd parameters end 3. Data Format: The data is stored as integer binary, with 2 bytes per data point. The actual stored data in this dataset is the brightness temperature multiplied by 10; divide the read value by 10 to obtain the true brightness temperature. Spatial resolution: 25 km; Temporal resolution: Daily, from 1978 to 1987. 4. Spatial Extent: Longitude: 60.1°E – 140.0°E; Latitude: 14.9°N – 55.0°N. 5. Data Reading Each set of remote sensing image data files can be opened in ENVI and ERDAS software.