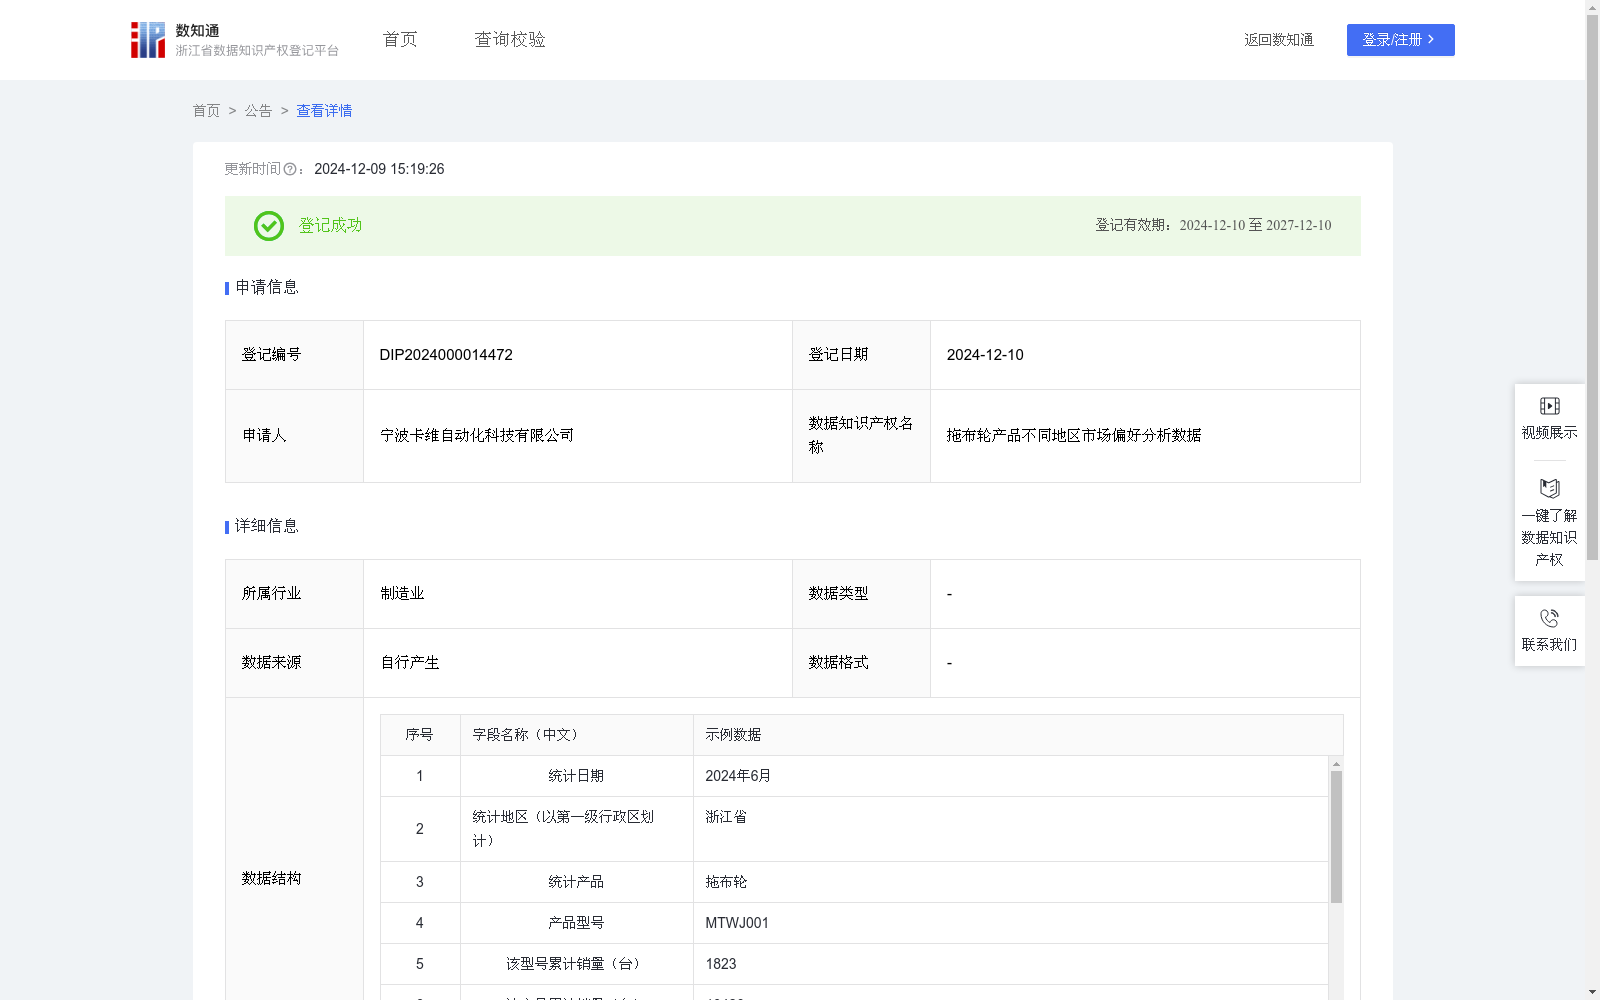
拖布轮产品不同地区市场偏好分析数据
收藏资源简介:
本数据可以帮助本公司利用偏好得分来识别对不同拖布轮型号产品有高偏好的地区,从而进行市场细分,为市场推广营销和其他市场决策提供数据支持; 其他拖布轮产品制造商可以通过分析统计地区和统计型号的市场渗透率、平均销售单价、价格弹性指数和偏好评分等数据,为其市场细分与目标市场选择、产品定位和开发、定价策略优化、营销活动优化等方面提供决策辅助; 本数据可为行业分析师分析拖布轮产品区域市场分布和市场潜在机会提供数据支持,为投资者和其他利益相关者提供洞察。 1.数据收集和预处理:(1)数据收集:收集公司内部销售管理平台对于不同地区不同规格拖布轮产品的销售统计信息,包括统计月份、统计地区、统计产品、产品型号、该型号累计销量、该产品累计销量。(2)数据预处理:对采集到的原始数据进行处理,去除缺失和异常数据。 2.市场渗透率计算:对于选定地区,计算每个型号的销量占该地区该产品总销量的比例即该型号在该地区的市场渗透率。 3.价格弹性分析:对于选定地区,计算每个型号产品在该地区的平均销售单价,根据价格弹性指数(PED)计算公式,基于该型号在该地区的平均销售单价和销售量变化情况计算该型号产品在该地区的价格弹性指数; 4.根据市场渗透率、价格弹性指数,为每个地区-型号组合计算一个偏好评分,计算公式为:偏好评分=α×市场渗透率+β×|价格弹性指数(PED)|,α 和 β 的值根据业务目标和市场策略来确定; 5.偏好结果判定:按以下规则对偏好结果进行判定:高偏好评分> 0.6;中偏好:0.4<评分≤0.6;低偏好:0≤评分 ≤0.4。
This dataset enables our company to identify regions with high preference for different mop wheel models using preference scores, thereby conducting market segmentation and providing data support for marketing promotions and other market decision-making. Other mop wheel manufacturers can analyze data such as market penetration rates, average selling prices, price elasticity indices, and preference scores by region and model, to provide decision-making assistance for their market segmentation, target market selection, product positioning and development, pricing strategy optimization, marketing campaign optimization and other aspects. This dataset can also provide data support for industry analysts to analyze the regional market distribution and potential market opportunities of mop wheel products, and offer insights for investors and other stakeholders. 1. Data Collection and Preprocessing: (1) Data Collection: Collect sales statistics information of mop wheel products of different specifications in different regions from the company's internal sales management platform, including statistical month, statistical region, statistical product, product model, cumulative sales volume of this model, and cumulative sales volume of this product. (2) Data Preprocessing: Process the collected raw data by removing missing and abnormal data. 2. Market Penetration Rate Calculation: For a selected region, calculate the proportion of the sales volume of each model in the total sales volume of this product in the region, which is the market penetration rate of this model in the region. 3. Price Elasticity Analysis: For a selected region, calculate the average selling price of each model of products in this region. Based on the price elasticity index (PED) calculation formula, calculate the price elasticity index of this model of products in this region according to the average selling price and changes in sales volume of this model in this region. 4. Preference Score Calculation: Calculate a preference score for each region-model combination based on the market penetration rate and price elasticity index. The calculation formula is: Preference Score = α × Market Penetration Rate + β × |Price Elasticity Index (PED)|, where the values of α and β are determined according to business objectives and market strategies; 5. Preference Result Judgment: Judge the preference results according to the following rules: High preference: Preference Score > 0.6; Medium preference: 0.4 < Preference Score ≤ 0.6; Low preference: 0 ≤ Preference Score ≤ 0.4.