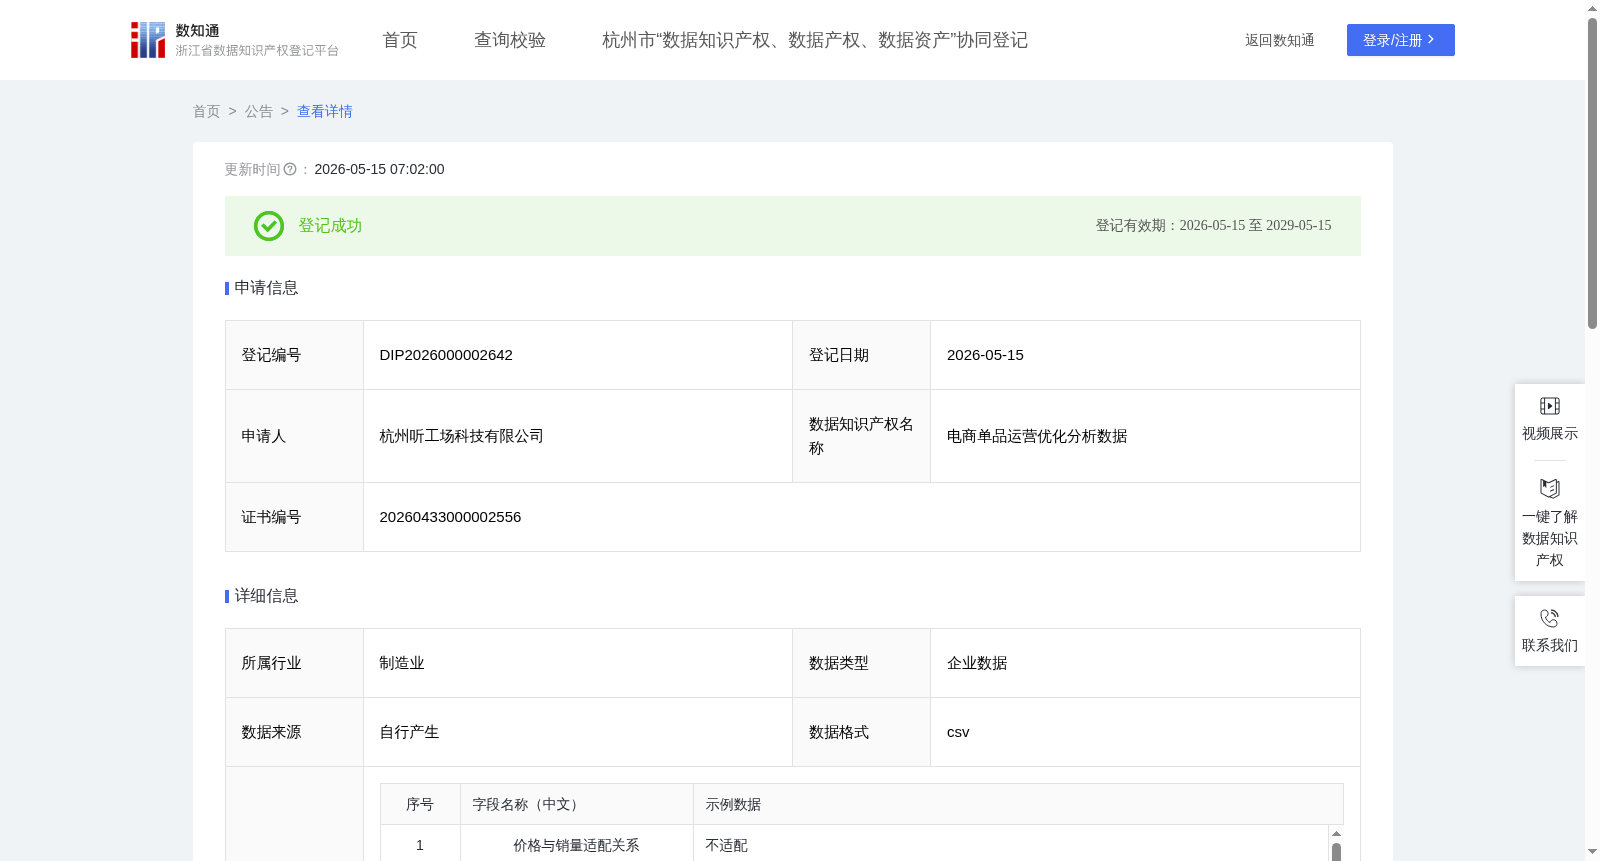
电商单品运营优化分析数据
收藏资源简介:
本数据资产应用于电商及零售企业的单品精细化运营场景,旨在解决多平台、多品牌商品管理中资源分配不均及市场响应滞后的问题。通过整合商品基础属性(品牌、类目、标题)、交易数据(月销量、销售额、价格)及渠道来源信息,构建全维度的单品表现评估体系。该数据结构覆盖从一级至三级类目的层级化分类,支持对海量 SKU 进行颗粒度精细的分析。主要价值在于利用销量与销售额占比指标,精准识别类目内的核心盈利单品与潜力爆款,辅助企业优化备货策略与流量投放方向;同时结合价格带销量适配规则,动态调整定价策略与库存结构,有效提升单品动销率与整体利润空间,为供应链快速响应市场需求提供量化依据。1. 数据采集:采集企业多平台电商交易及商品主数据,字段包括:数据月份 (data_month)、平台名称 (platform)、品牌名称 (brand_name)、商品标题 (product_title)、标准一/二/三级类目名称 (source_standard_first/second/third_category_name)、商品价格 (product_price)、商品月销量 (product_sales_volume)、商品月销售额 (product_sales_amount)、单品价格带标识(price_band_flag )。同时采集企业维度汇总数据用于计算占比。 2. 数据处理与计算:对原始数据进行清洗,剔除测试订单及异常退款记录。基于清洗后数据执行以下计算: - 单品月度销量占比 (product_sales_ratio) = (单品本月线上销量 ÷ 该企业同期总销量) × 100% - 单品月度销售额占比 (product_sales_value_ratio) = (单品本月线上销售额 ÷ 该企业同期总销售额) × 100% - 价格与销量适配关系 (price_sales_match_flag):设定阈值逻辑,若 (低价带销量≥30 件) 或 (中价带销量≥50 件) 或 (高价带销量≥10 件),标记为'适配',否则标记为'不适配'。 - 单品价格带标识(price_band_flag ): 单品价格带标识为低价带(价格≤所属三级类目均价50% )且销量≥50件,则为适配, 当单品价格带标识为中价带(所属三级类目均价51% ≤价格≤所属三级类目均价149% )且销量≥30件,则为适配, 单品价格带标识为中价带(所属三级类目均价150% ≤价格)且销量≥10件,则为适配。 其余为不适配。 3. 分级优化策略:根据计算结果实施差异化运营: 基于数据计算结果,实施差异化单品运营优化,简化如下: 1. 核心盈利品:销量占比≥2%、销售额占比≥3%,且价格与销量适配,重点加大流量投放,保障库存充足,维持定价稳定,最大化盈利。 2. 潜力爆款:销量占比 0.5%-2%、销售额占比 1%-3%,适配价格带,优化商品标题及详情页,适度倾斜流量,培育成核心品。 3. 常规动销品:销量、销售额占比达标但适配性不足,调整定价至对应价格带阈值,优化备货量,提升动销率。 4. 低效品:销量占比 < 0.5%、销售额占比 < 1%,或适配性差,缩减流量投放,清理库存,必要时下架,优化资源分配。 策略结合每月更新数据,动态调整,精准匹配市场需求,提升单品运营效率与整体利润。
This data asset is applied to the scenario of refined SKU operation for e-commerce and retail enterprises, aiming to solve the problems of uneven resource allocation and delayed market response in multi-platform and multi-brand product management. By integrating basic product attributes (brand, category, title), transaction data (monthly sales volume, sales amount, price) and channel source information, it constructs a full-dimensional SKU performance evaluation system. This data structure covers hierarchical classification from first-level to third-level categories, supporting fine-grained analysis of massive SKUs. Its core value lies in accurately identifying core profitable SKUs and potential hit products within the category using sales volume and sales value ratio metrics, assisting enterprises in optimizing inventory strategies and traffic allocation directions; meanwhile, combined with price band and sales matching rules, it dynamically adjusts pricing strategies and inventory structures, effectively improving SKU sell-through rates and overall profit margins, and providing quantitative basis for the supply chain to quickly respond to market demands. 1. Data Collection: Collect multi-platform e-commerce transaction and master product data of the enterprise, with the following fields: data_month, platform, brand_name, product_title, source_standard_first/second/third_category_name, product_price, product_sales_volume, product_sales_amount, price_band_flag. Enterprise-level aggregated data is also collected for ratio calculation. 2. Data Processing and Calculation: Clean the original data, eliminate test orders and abnormal refund records. Perform the following calculations based on the cleaned data: - Product Monthly Sales Volume Ratio (product_sales_ratio) = (Online sales volume of the SKU in the current month ÷ Total sales volume of the enterprise in the same period) × 100% - Product Monthly Sales Value Ratio (product_sales_value_ratio) = (Online sales amount of the SKU in the current month ÷ Total sales amount of the enterprise in the same period) × 100% - Price and Sales Matching Flag (price_sales_match_flag): Set threshold logic, mark as "Matched" if (low-price band sales volume ≥30 units) OR (mid-price band sales volume ≥50 units) OR (high-price band sales volume ≥10 units), otherwise mark as "Unmatched". - Product Price Band Flag (price_band_flag): If the product's price band is low-price band (price ≤ 50% of the average price of its third-level category) and sales volume ≥50 units, it is marked as matched; If the product's price band is mid-price band (51% of the average price of its third-level category ≤ price ≤ 149% of the average price of its third-level category) and sales volume ≥30 units, it is marked as matched; If the product's price band is mid-price band (price ≥ 150% of the average price of its third-level category) and sales volume ≥10 units, it is marked as matched; All other cases are marked as unmatched. 3. Hierarchical Optimization Strategy: Implement differentiated operations based on the calculation results. Based on the data calculation results, implement differentiated SKU operation optimization, simplified as follows: 1. Core Profitable SKUs: SKUs with sales volume ratio ≥2%, sales value ratio ≥3%, and matched price and sales status. Focus on increasing traffic allocation, ensuring sufficient inventory, maintaining stable pricing, and maximizing profits. 2. Potential Hit Products: SKUs with sales volume ratio between 0.5% and 2%, sales value ratio between 1% and 3%, and matched price and sales status. Optimize product titles and detail pages, appropriately allocate more traffic, and cultivate them into core profitable SKUs. 3. Regular Sell-through SKUs: SKUs that meet the sales volume and sales value ratio requirements but have poor price-sales matching. Adjust pricing to the corresponding price band threshold, optimize inventory allocation, and improve sell-through rates. 4. Low-efficiency SKUs: SKUs with sales volume ratio <0.5%, sales value ratio <1%, or poor price-sales matching. Reduce traffic allocation, clear inventory, discontinue them when necessary, and optimize resource allocation. This strategy is dynamically adjusted with monthly updated data to accurately match market demands, improve SKU operation efficiency and overall profits.