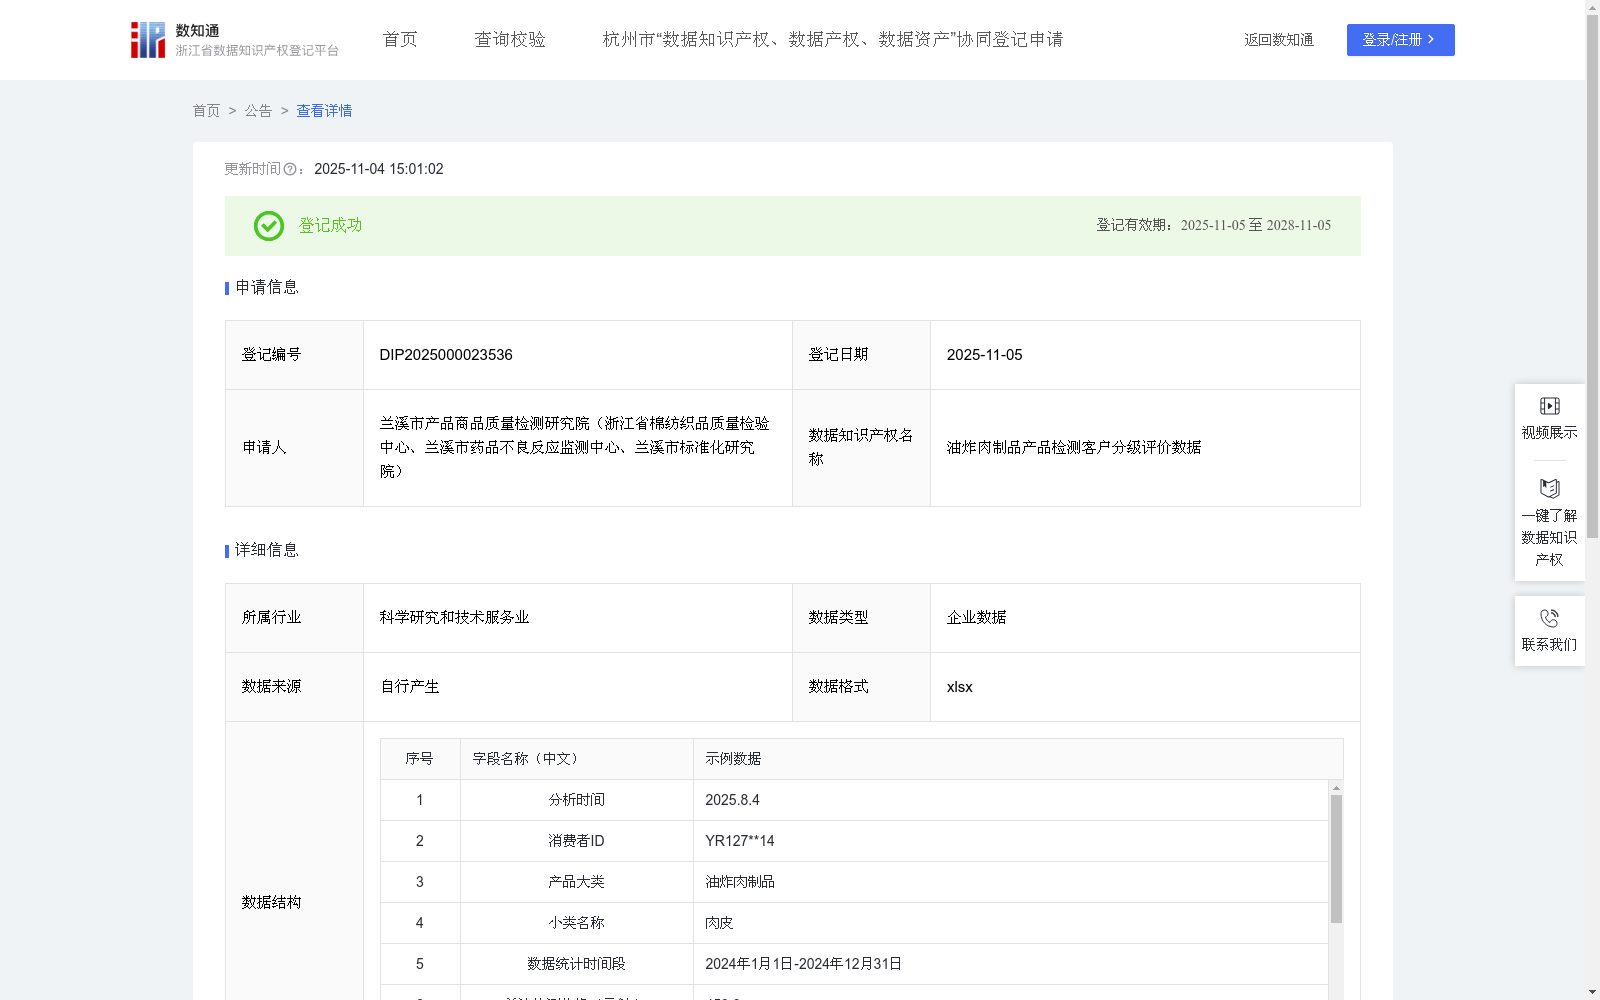
油炸肉制品产品检测客户分级评价数据
收藏资源简介:
通过分析油炸肉制品产品检测客户的最近一次检测时间R(天数)、检测频率F(次数)、检测总金额M(元)数据,采用RFM模型对客户进行分级评价,用RFM分析方法把客户分为ABCD四级。根据客户消费特征设计差异化营销,用数据驱动客户管理,提升客户满意度,优化资源配置,通过分级管理,既能让高价值客户获得专属权益以增强忠诚度,又能通过标准化服务覆盖基础客户,最终实现业务增长与客户价值的双赢。并为同行业企业管理不同等级的客户,实现精准个性化服务提供数据支持。1、数据处理:对采集到的数据进行脱敏、降噪、清洗、聚集、分析。2、数据加工:基于 RFM 模型,结合客户的最近一次检测时间R(天数)、检测频率F(次数)、检测总金额M(元)用percentrank函数对客户进行打分,得到:R得分、F得分、M得分。(a).最近一次检测时间R(天数)间隔最短的客户排在最上面。按照从1-5评分,前20%的客户获得5分,接下来的20%客户获得4分,再下来20%的客户为3分,再下来20% 的客户为2分,最后20% 的客户为1分。 (b).根据客户检测频率F(次数)从高到底依次对用户进行评分,前20%的客户在检测频率F(次数)的分数为5,以此类推。 (c). 根据客户检测总金额M(元)从高到底依次对用户进行评分,前20%的客户在检测总金额M(元)的分数为5,以此类推。检测总金额M(元)最少的20%客户则分数为1。 RFM得分=0.3*(R得分)+0.3*(F得分)+0.4*(M得分)3、 数据运用:RFM得分大于等于4分的为A级客户,大于等于3小于4的为B级客户,大于等于2小于3的为C 级客户,低于2的为D 级客户。通过对不同等级客户实施差异化服务,来提升客户满意度与企业效益。
This dataset is constructed for customer grading and evaluation of fried meat product testing services using the RFM model. The three core metrics are: R (days), the customer's most recent testing interval; F (times), the customer's testing frequency; and M (yuan), the customer's total testing amount. Customers are divided into four tiers (A, B, C, D) via RFM analysis. Differentiated marketing strategies are designed based on customer consumption characteristics, enabling data-driven customer management to improve customer satisfaction and optimize resource allocation. Through tiered management, high-value customers can obtain exclusive benefits to enhance their loyalty, while basic customers are served with standardized services, ultimately achieving a win-win outcome of business growth and customer value. This dataset also provides data support for peer enterprises to manage customers of different tiers and deliver precise personalized services. 1. Data Processing: The collected data is subjected to anonymization, denoising, cleaning, aggregation and analysis. 2. Data Scoring & Enrichment: Based on the RFM model, the percentrank function is used to score customers using the three metrics mentioned above, generating three individual scores: R Score, F Score and M Score. (a) Customers are sorted in descending order of their most recent testing interval R (i.e., customers with shorter R intervals are ranked first). They are scored from 1 to 5: the top 20% of customers receive a score of 5, the next 20% receive 4, followed by 3, 2, and the bottom 20% receive 1. (b) Customers are ranked in descending order of their testing frequency F, and scored in the same way: the top 20% get a score of 5, and so on. (c) Customers are ranked in descending order of their total testing amount M, and scored similarly: the top 20% receive a score of 5, while the bottom 20% (with the smallest M) receive a score of 1. The composite RFM score is calculated as: RFM Score = 0.3 * R Score + 0.3 * F Score + 0.4 * M Score. 3. Data Application: Customers are classified into four tiers based on their composite RFM score: Tier A customers have a score ≥4; Tier B customers have 3 ≤ score <4; Tier C customers have 2 ≤ score <3; Tier D customers have a score <2. Differentiated services are provided for customers of different tiers to improve customer satisfaction and corporate benefits.