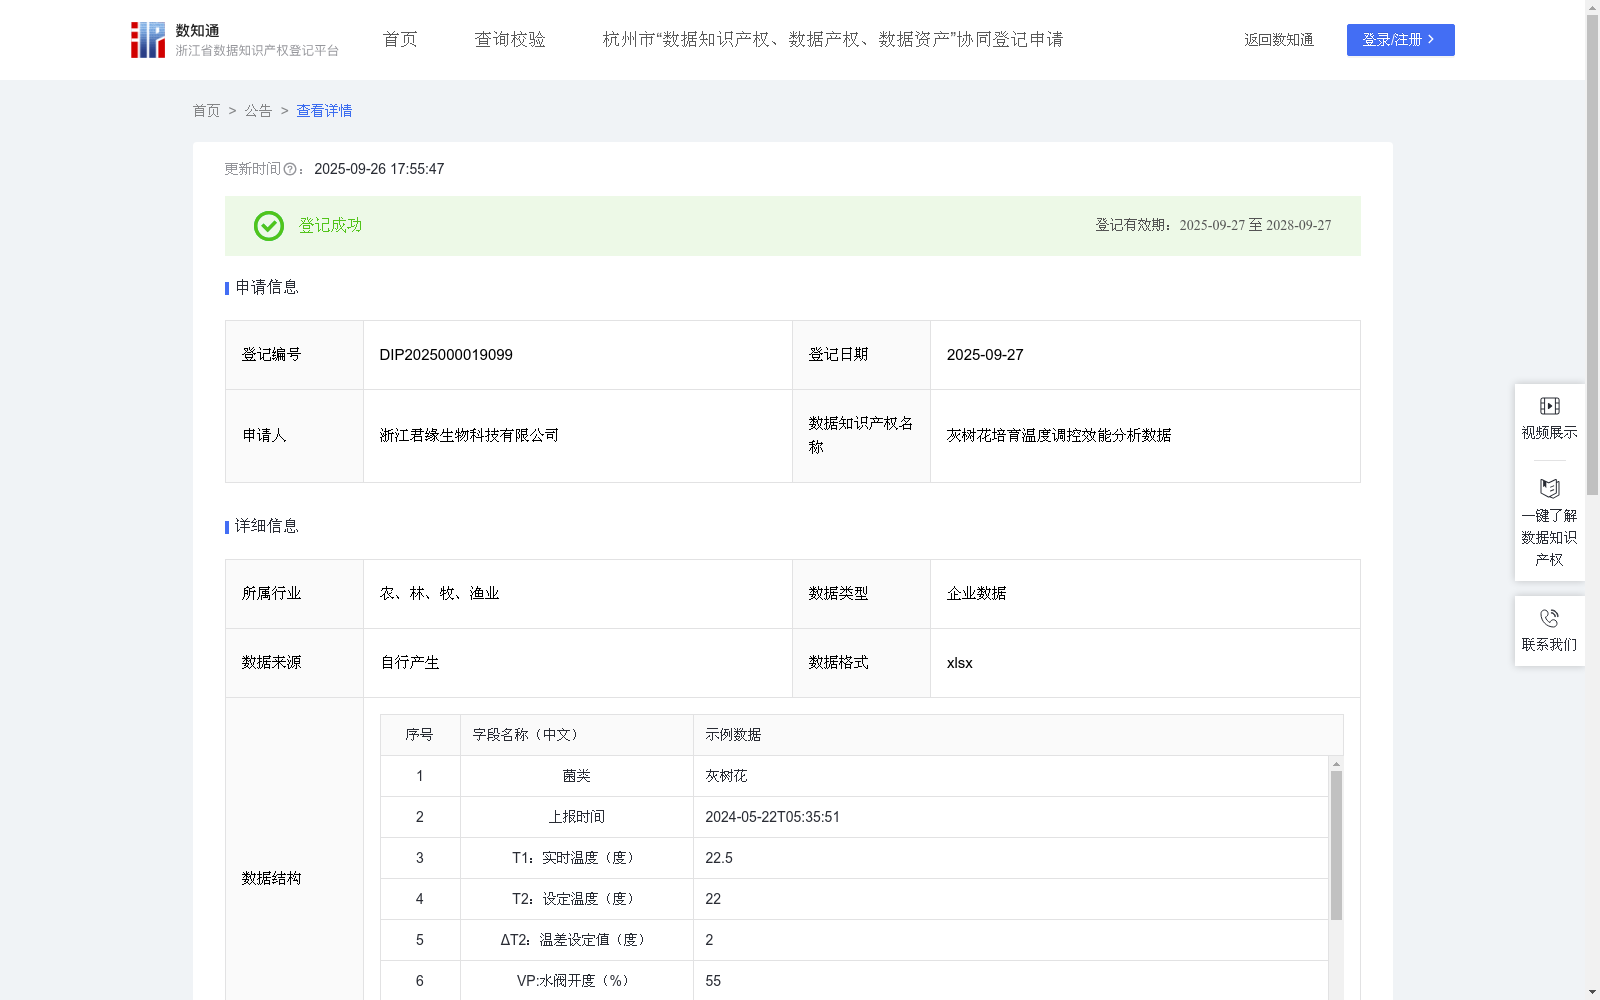
灰树花培育温度调控效能分析数据
收藏资源简介:
1. 智能预警与运维: 替代传统简单的“超限报警”,提供更早、更精准的故障预警。例如,温度尚未超限,但水阀已开到最大且温度仍缓慢上升,ETI值会持续下降,系统可提前发出“制冷能力不足”的预警。 2. 种植工艺优化: 对比培育室ETI历史曲线,可以评估哪种环境控制策略(设定温度、水阀响应参数)更稳定、更节能,从而优化种植SOP(标准作业程序)。 3. 数据资产化: 稳定的、高质量的ETI数据可以作为公司数字资产,未来在引入农业物联网保险、申请绿色认证、进行智慧农业项目申报。1. 输入数据 (原始数据): T1: 实时温度 (℃);T2: 设定温度 (℃) ΔT2: 温差设定值(允许波动的阈值,如 ±0.5℃)VP: 水阀开度 (%) 2. 算法公式: ETI = [WT * (1 - TD)] + [WV * (1 -VD)] 其中:TD (温度偏差系数),计算实际温度与设定温度的绝对差值:|T1 - T2| 将该差值映射到 0-1 之间(1代表最差偏差,0代表无偏差)。使用设定温差ΔT2作为尺度。 TD = min( |T1 - T2| / (2 *ΔT2), 1.0) 说明:当温差超过 2 *ΔT2(即允许范围的两倍)时,认为偏差达到最大(值为1)。 VD (水阀响应偏差系数) 理想情况下,温度偏差越大,水阀开度应越大(用于加湿/降温)或越小(用于加热/保温)。此处我们以降温工况为例(温度过高,水阀应开大进行喷雾降温): 定义一个理想的水阀开度响应值:VI= min( max(0, (T1 - T2) / ΔT2 * 50), 100)。 (T1 - T2):正数代表温度过高。 (T1 - T2) / ΔT2:表示过高了多少个“允许单位”。 * 50:是一个比例因子,表示每过一个“允许单位”,理想水阀开度增加50%。这个参数可根据具体大棚的制冷/加湿能力进行调整。 计算实际水阀开度与理想开度的绝对差值,并归一化:VD = min( |VP - VI| / 100, 1.0) WT, WV 是权重系数,代表温度和阀门在综合评估中的重要程度,且 WT + WV = 1。例如,可以设定 WT = 0.7, WV = 0.3,表示温度控制的准确性更重要。 3. 输出:ETI 值:范围在 0 到 1 之间。ETI ≈ 1:完美状态。温度稳定,水阀响应精准,0.8 ≤ ETI < 1:良好状态。调控系统工作有效。0.6 ≤ ETI < 0.8:一般状态。存在轻微偏差,需关注,ETI < 0.6:预警状态。调控效能低下,需要立即人工干预,检查传感器或执行机构(水阀)是否故障。
1. Intelligent Early Warning and Operational Maintenance: Instead of the traditional simple "limit exceeding alarm", it provides earlier and more accurate fault early warning. For example, when the temperature has not exceeded the limit, but the water valve is fully open and the temperature is still rising slowly, the ETI value will continue to drop, and the system can issue an early warning of "insufficient cooling capacity" in advance. 2. Cultivation Process Optimization: By comparing the historical ETI curves of the cultivation chamber, it is possible to evaluate which environmental control strategy (set temperature, water valve response parameters) is more stable and energy-saving, so as to optimize the cultivation SOP (Standard Operating Procedure). 3. Data Assetization: Stable and high-quality ETI data can serve as the company's digital assets for future applications such as introducing agricultural IoT insurance, applying for green certifications, and declaring smart agriculture projects. 1. Input Data (Raw Data): T1: Real-time Temperature (℃); T2: Set Temperature (℃); ΔT2: Temperature Difference Setpoint (allowable fluctuation threshold, e.g., ±0.5℃); VP: Water Valve Opening (%) 2. Algorithm Formula: ETI = [WT * (1 - TD)] + [WV * (1 - VD)] Where: TD (Temperature Deviation Coefficient): Calculate the absolute difference between the actual temperature and the set temperature: |T1 - T2|. Map this difference to the range of 0-1 (1 represents the worst deviation, 0 represents no deviation), using the set temperature difference ΔT2 as the scale. TD = min( |T1 - T2| / (2 * ΔT2), 1.0 ) Note: When the temperature difference exceeds 2 * ΔT2 (i.e., twice the allowable range), the deviation is considered to reach the maximum (value of 1). VD (Water Valve Response Deviation Coefficient): Ideally, the larger the temperature deviation, the larger (for humidification/cooling) or smaller (for heating/heat preservation) the water valve opening should be. Here, we take the cooling working condition as an example (excessive temperature, the water valve should be opened fully for spray cooling): Define an ideal water valve opening response value: VI = min( max(0, (T1 - T2) / ΔT2 * 50), 100 ) (T1 - T2): A positive value indicates excessive temperature. (T1 - T2) / ΔT2: Indicates how many "allowable units" the temperature exceeds the setpoint. * 50: Is a proportional factor, indicating that for each "allowable unit" exceeded, the ideal water valve opening increases by 50%. This parameter can be adjusted according to the cooling/humidification capacity of the specific greenhouse. Calculate the absolute difference between the actual water valve opening and the ideal opening, and normalize it: VD = min( |VP - VI| / 100, 1.0 ) WT and WV are weight coefficients representing the importance of temperature and valve in the comprehensive evaluation, and WT + WV = 1. For example, WT = 0.7 and WV = 0.3 can be set, indicating that the accuracy of temperature control is more important. 3. Output: ETI value ranges from 0 to 1. - ETI ≈ 1: Perfect state. Stable temperature, precise water valve response. - 0.8 ≤ ETI < 1: Good state. The control system operates effectively. - 0.6 ≤ ETI < 0.8: Fair state. Minor deviations exist, requiring attention. - ETI < 0.6: Early warning state. Poor control efficiency, requiring immediate manual intervention to check whether the sensors or actuators (water valve) are faulty.