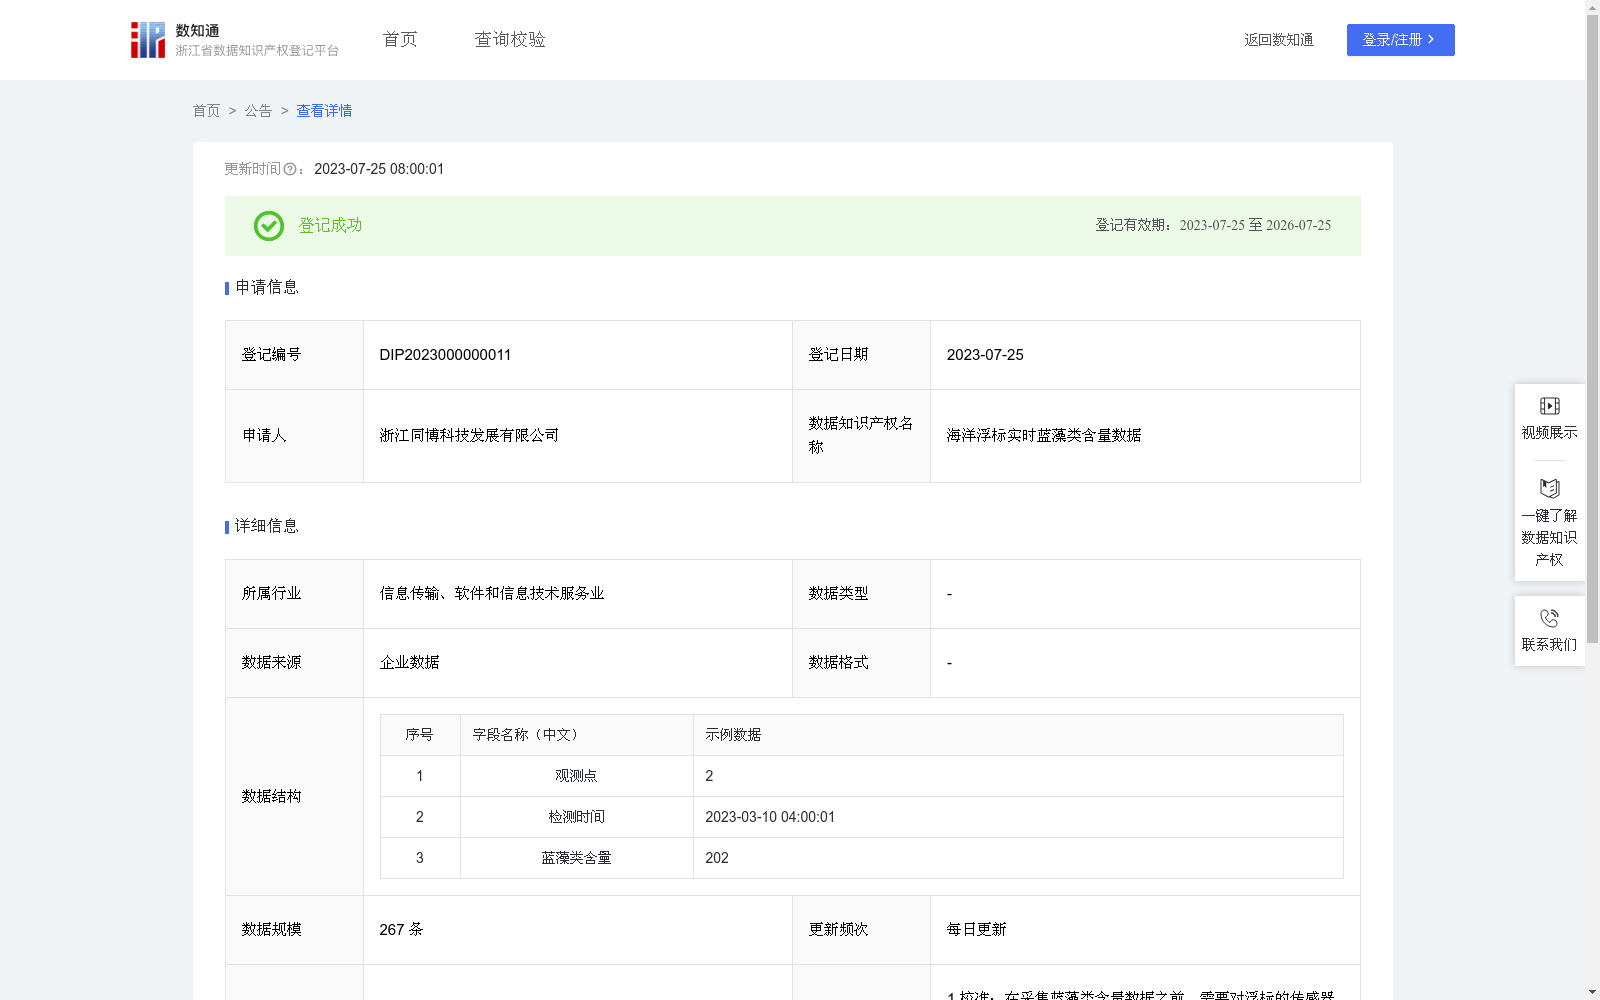
海洋浮标实时蓝藻类含量数据
收藏资源简介:
通过蓝藻类传感器信息来监控观测点的实时数据,实时监测海洋中蓝藻的浓度和分布情况,提高养殖和渔业生产的效益和安全性,为大黄鱼养殖平台及海洋大数据服务平台等提供数据支持。1.校准:在采集蓝藻类含量数据之前,需要对浮标的传感器进行校准,以保证数据的准确性。 2.采集:浮标会定时采集海水的蓝藻类含量数据,经过AD转换后得到准确的数字数据,并将其发送到地面站或卫星上。 3.预处理:接收到蓝藻类含量数据后,需要进行预处理,需要进行crc校验,以提高数据的可靠性和稳定性。 4.转换:由于蓝藻类含量与海水中的蓝藻类浓度有关,根据计算公式,将藻细胞数转化为蓝藻类密度,根据密度和相关物理量之间的关系进行计算,并将密度转化为相应的物理量。5.存储和分析:转换后的数据可以存储在数据库中,通过计算平均值、波动范围,采用支持向量机(SVM)模型,根据提取的特征,设计SVM的核函数和其他参数,并利用已有数据对SVM进行训练。进行时序分析、趋势分析以供后续的数据分析和应用使用。
Monitor real-time data at observation points via cyanobacteria sensor information, conduct real-time detection of the concentration and distribution of cyanobacteria in the ocean to improve the efficiency and safety of aquaculture and fishery production, and provide data support for platforms such as large yellow croaker farming platforms and marine big data service platforms. 1. Calibration: Before collecting cyanobacteria content data, it is necessary to calibrate the sensors of the buoy to ensure the accuracy of the data. 2. Data Collection: The buoy will regularly collect cyanobacteria content data in seawater, obtain accurate digital data after AD conversion, and transmit the data to a ground station or satellite. 3. Preprocessing: After receiving the cyanobacteria content data, preprocessing is required, including CRC check, to improve the reliability and stability of the data. 4. Data Conversion: Since cyanobacteria content is related to the concentration of cyanobacteria in seawater, convert the number of algal cells into cyanobacteria density according to the calculation formula, perform calculations based on the relationship between density and related physical quantities, and convert the density into corresponding physical quantities. 5. Storage and Analysis: The converted data can be stored in a database. By calculating the average value and fluctuation range, the Support Vector Machine (SVM) model is adopted. Design the kernel function and other parameters of the SVM based on the extracted features, and train the SVM using existing data to conduct time-series analysis and trend analysis for subsequent data analysis and applications.