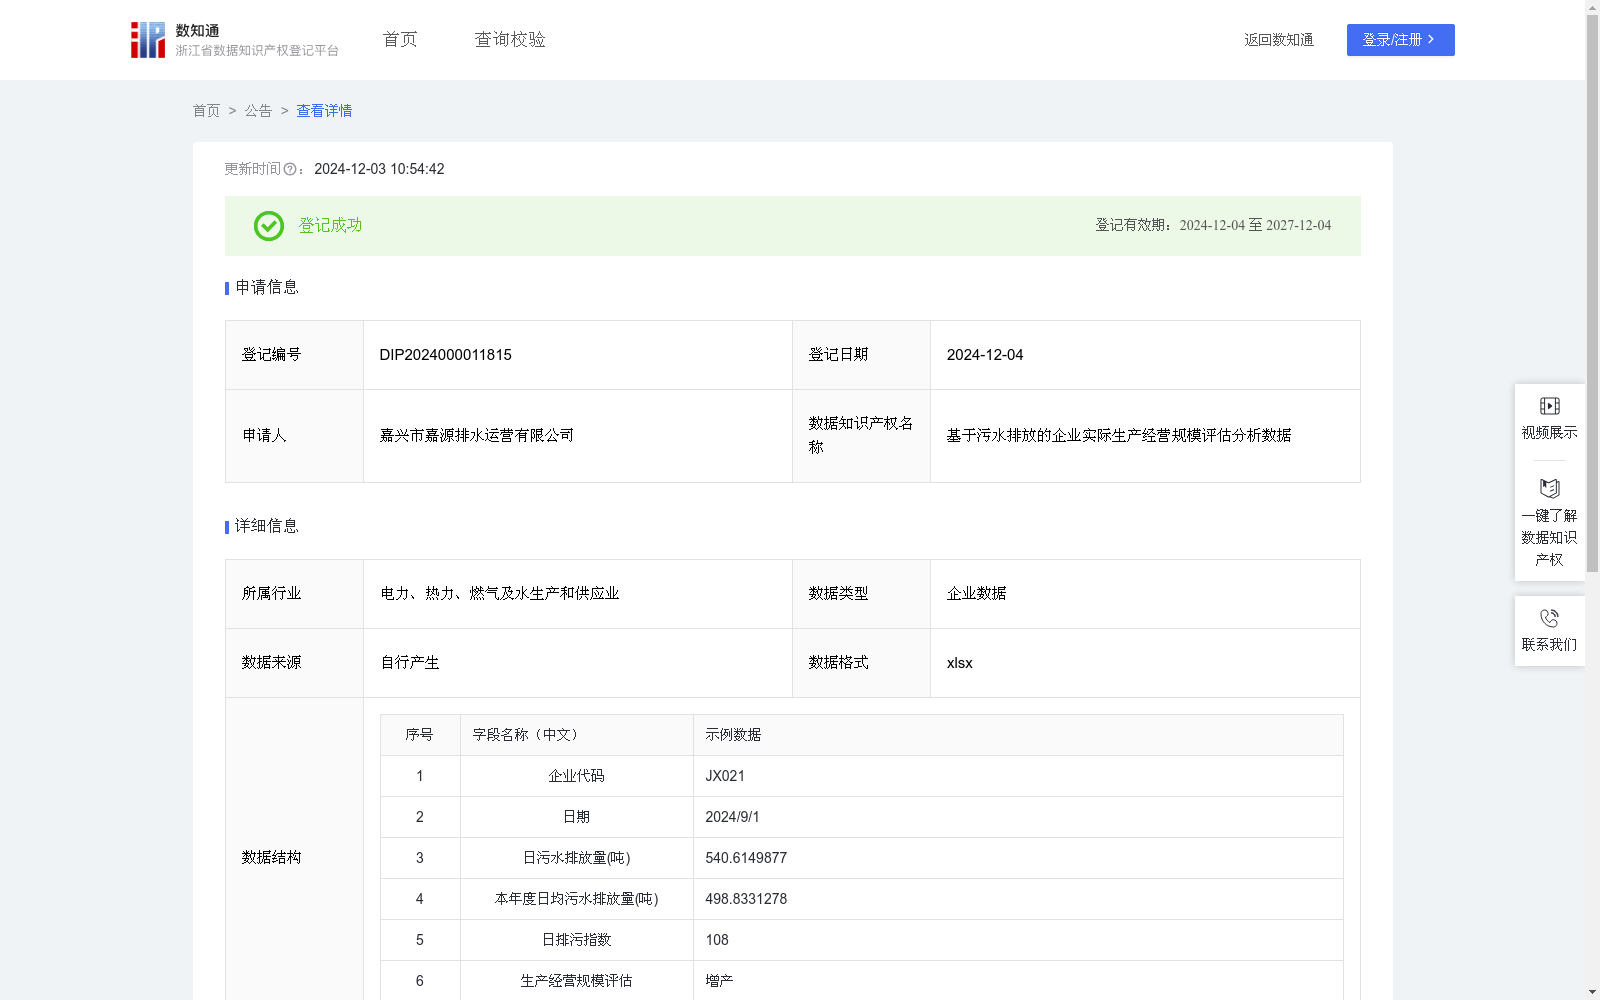
基于污水排放的企业实际生产经营规模评估分析数据
收藏资源简介:
在授信、信用贷等金融服务中,由于营收、资产等财务数据存在伪造风险,因此银行等金融机构对于生产型企业的评估维度除了常规的财务数据,对能够反映实际生产经营规模的用水、排水、用电等数据尤为重视。 在嘉兴区域内,通过对智慧污水管理平台汇集的企业历史污水排放数据进行统计与分析,构建企业生产规模变化趋势图。以此帮助金融机构进行贷前贷中贷后的风险管控,降低融资风险分析,提升金融服务的安全性与多维性算法原理: 对于生产型企业而言,其生产经营规模与其污水排放呈正相关,因此污水的排放量能够在一定程度对反映企业的生产经营规模情况。通过对污水排放量等数据进行分析,获得排污指数,能够保证不泄露企业实际的污水排放的情况下,对企业的生产经营规模进行评估。 数据采集: 安置在企业排污口的流量计能够实时监测企业的污水排放量,通过OCR设备对流量计进行监控,并通过物联网将流量计的数据汇总至系统。 数据分析: 单个周期的数据分析时长为1年,系统会对目标企业当年度的【日污水排放量】进行相加求平均值,得到【本年度日均污水排放量】。 【日排污指数】=【日污水排放量】/【本年度日均污水排放量】*100 (1)【日排污指数】<=10,停产 (2)10<【日排污指数】<=95,减产 (3)95<【日排污指数】<=105,正常生产 (4)【日排污指数】>105,增产 根据分析数据能够生成企业的生产经营规模趋势图,在确保不暴露企业排污数据的情况下,实现对企业的生产经营规模趋势进行评估与分析。
In financial services such as credit granting and credit loans, financial institutions like banks pay special attention to data reflecting actual production and operation scale, such as water use, drainage and electricity consumption, in addition to conventional financial data, due to the risk of fabrication in financial data including revenue and assets. In the Jiaxing region, statistical analysis is conducted on the historical sewage discharge data of enterprises collected by the smart sewage management platform, to construct the trend chart of production scale changes for enterprises. This helps financial institutions carry out risk management and control in pre-loan, during-loan and post-loan stages, reduce financing risk assessment, and improve the security and multidimensionality of financial services. Algorithm Principle: For manufacturing enterprises, their production and operation scale is positively correlated with sewage discharge, so the sewage discharge volume can reflect the production and operation status of enterprises to a certain extent. By analyzing data such as sewage discharge volume to obtain the sewage discharge index, the production and operation scale of enterprises can be evaluated without disclosing their actual sewage discharge data. Data Collection: Flow meters installed at the sewage outlets of enterprises can monitor the enterprise's sewage discharge volume in real time. The flow meters are monitored via OCR equipment, and their data is aggregated to the system through the Internet of Things (IoT). Data Analysis: The analysis period for a single cycle is 1 year. The system will sum the daily sewage discharge volume of the target enterprise in the current year and calculate the average value to obtain the [Average Daily Sewage Discharge Volume of the Current Year]. The [Daily Sewage Discharge Index] = [Daily Sewage Discharge Volume] / [Average Daily Sewage Discharge Volume of the Current Year] * 100. (1) [Daily Sewage Discharge Index] ≤ 10: Suspended Production (2) 10 < [Daily Sewage Discharge Index] ≤ 95: Reduced Production (3) 95 < [Daily Sewage Discharge Index] ≤ 105: Normal Production (4) [Daily Sewage Discharge Index] > 105: Increased Production Based on the analyzed data, the trend chart of the enterprise's production and operation scale can be generated, enabling the evaluation and analysis of the enterprise's production and operation scale trend without exposing its sewage discharge data.