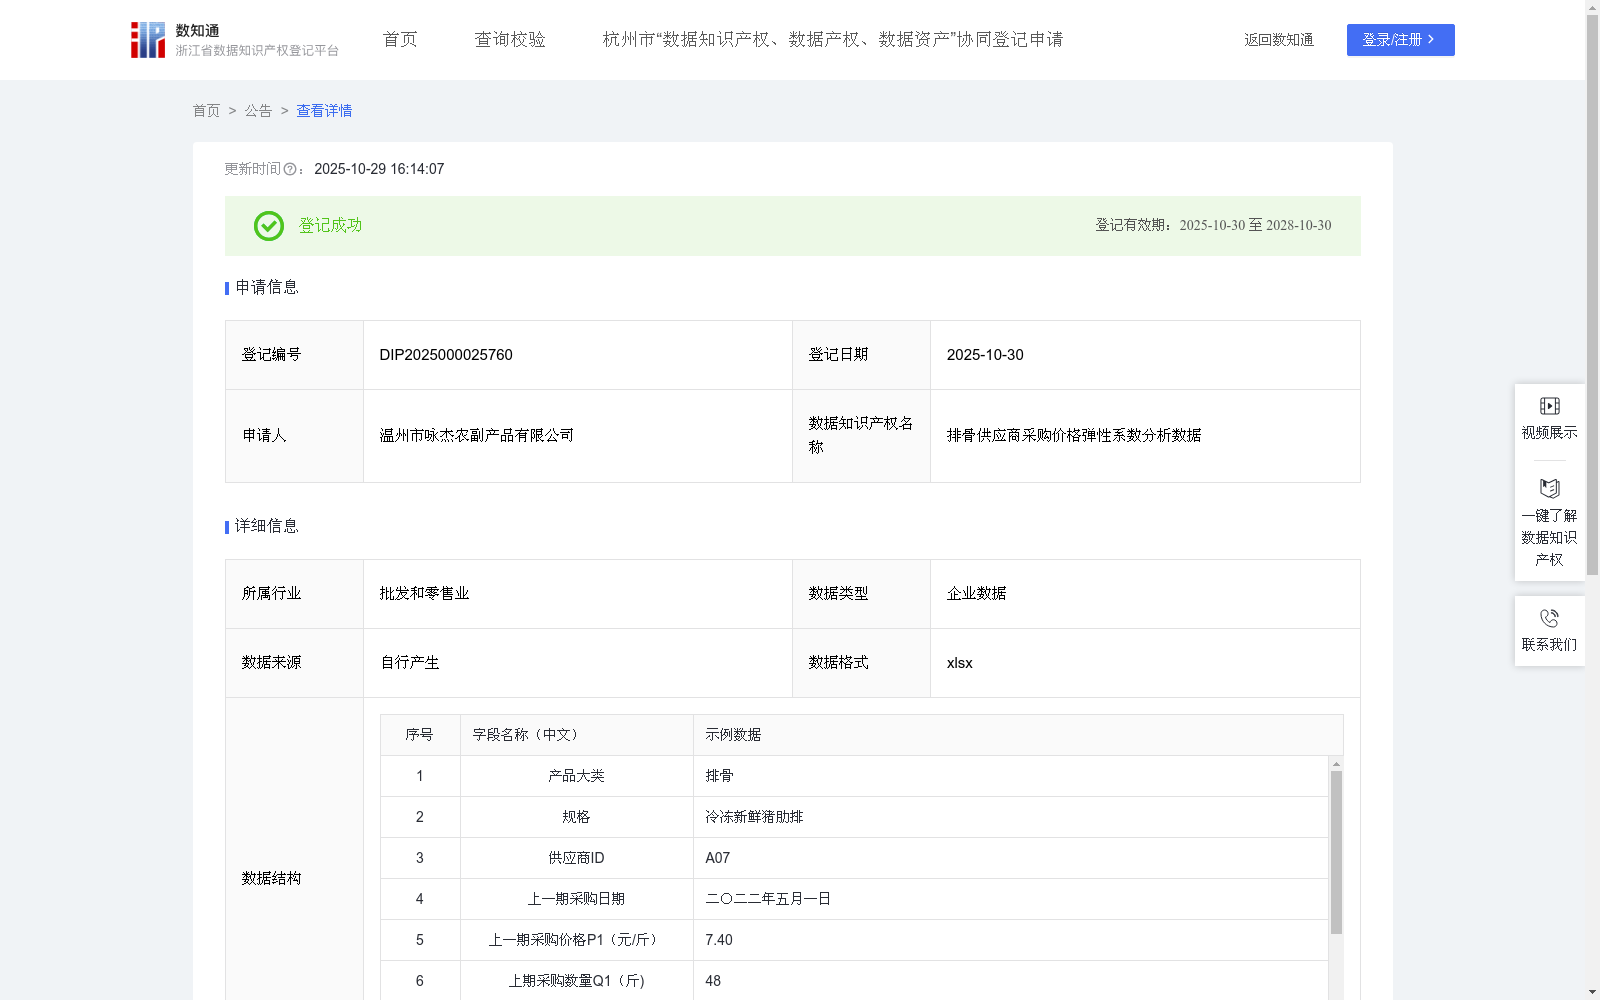
排骨供应商采购价格弹性系数分析数据
收藏资源简介:
本数据的内部应用场景作用包括以下:1.采购策略动态调整,通过弹性系数(|Es|)量化供应商价格敏感度,企业可制定差异化谈判策略。例如,当|Es|>1时,供应商采购量对价格变动反应强烈,企业可通过批量采购换取折扣;若|Es|<1,则需考虑长期协议锁定价格,避免成本波动。2.供应链风险预警,弹性系数异常波动可揭示潜在风险。若某供应商|Es|骤升或者骤降,可能反映其产能不稳定或市场垄断,需启动备选供应商预案。内部系统可设置阈值自动预警,触发审核流程,确保供应链韧性。在外部应用场景作用包括以下:1.市场趋势预判,行业平均|Es|值反映供需平衡。若某一时间段多数供应商|Es|>1.2,表明排骨市场供过于求,企业可延迟采购;反之则需提前备货。2.竞品策略对标,通过公开数据对比竞品采购弹性,发现差异化机会。1、数据采集自企业内部,对数据进行清洗,去除异常值、消除重复数据,确保数据的准确性。 2、算法公式: |Es| ={(Q2-Q1)/((Q2+Q1)/2)}/{(P2-P1)/((P2+P1)/2 )}, |Es|为供应商采购价格弹性系数,P1为供应商的排骨上一期采购价格 (元/斤);P2为对供应商的排骨本期采购价格P2(元/斤);Q1为对供应商的排骨上一期采购数量(斤);Q2 为对供应商的排骨本期采购数量(斤) ,(1)富有弹性:|Es| >1,表明对供应商采购量变动大于价格变动。 (2)缺乏弹性:|Es| <1,即对供应商采购量变动小于价格变动。 (3)单位弹性:|Es| =1,此时对供应商的采购量变动与价格变动相等 (4)完全无弹性:|Es| =0,对供应商的采购量对价格变动毫无反应, 3、|Es|反映了供应商采购量变动对于价格变动的反应程度,即价格上升或下降时,随之而来采购量的变化情况。
The internal application scenarios and functions of this dataset are as follows: 1. Dynamic adjustment of procurement strategies: Quantify suppliers' price sensitivity with the elasticity coefficient (|Es|), enabling enterprises to formulate differentiated negotiation strategies. For example, when |Es| > 1, the supplier's procurement volume is highly responsive to price changes, and the enterprise can exchange bulk purchases for discounts; if |Es| < 1, long-term agreements should be considered to lock in prices and avoid cost fluctuations. 2. Supply chain risk early warning: Abnormal fluctuations in the elasticity coefficient can reveal potential risks. If a certain supplier's |Es| rises or drops sharply, it may reflect the supplier's unstable production capacity or market monopoly, and the alternative supplier contingency plan needs to be activated. The internal system can set thresholds for automatic early warning and trigger the audit process to ensure supply chain resilience. The external application scenarios and functions are as follows: 1. Market trend prediction: The industry average |Es| value reflects the balance between supply and demand. If most suppliers have |Es| > 1.2 within a certain period, it indicates that the pork rib market is oversupplied, and enterprises can delay procurement; conversely, they need to stock up in advance. 2. Competitor strategy benchmarking: Compare the procurement elasticity of competitors through public data to identify differentiated opportunities. 1. Data is collected from within the enterprise, cleaned to remove outliers and duplicate data, ensuring data accuracy. 2. Algorithm formula: |Es| = [(Q2 - Q1) / ((Q2 + Q1) / 2)] / [(P2 - P1) / ((P2 + P1) / 2)], where |Es| is the supplier's procurement price elasticity coefficient, P1 is the purchase price of pork ribs from the supplier in the previous period (yuan/jin); P2 is the purchase price of pork ribs from the supplier in the current period (yuan/jin); Q1 is the purchase quantity of pork ribs from the supplier in the previous period (jin); Q2 is the purchase quantity of pork ribs from the supplier in the current period (jin). (1) Elastic: |Es| > 1, indicating that the change in procurement volume from the supplier is greater than the change in price. (2) Inelastic: |Es| < 1, meaning that the change in procurement volume from the supplier is less than the change in price. (3) Unit elasticity: |Es| = 1, at which point the change in procurement volume from the supplier is equal to the change in price. (4) Perfectly inelastic: |Es| = 0, meaning that the supplier's procurement volume has no response to price changes. 3. |Es| reflects the degree of response of the supplier's procurement volume changes to price changes, that is, the changes in procurement volume that follow when prices rise or fall.