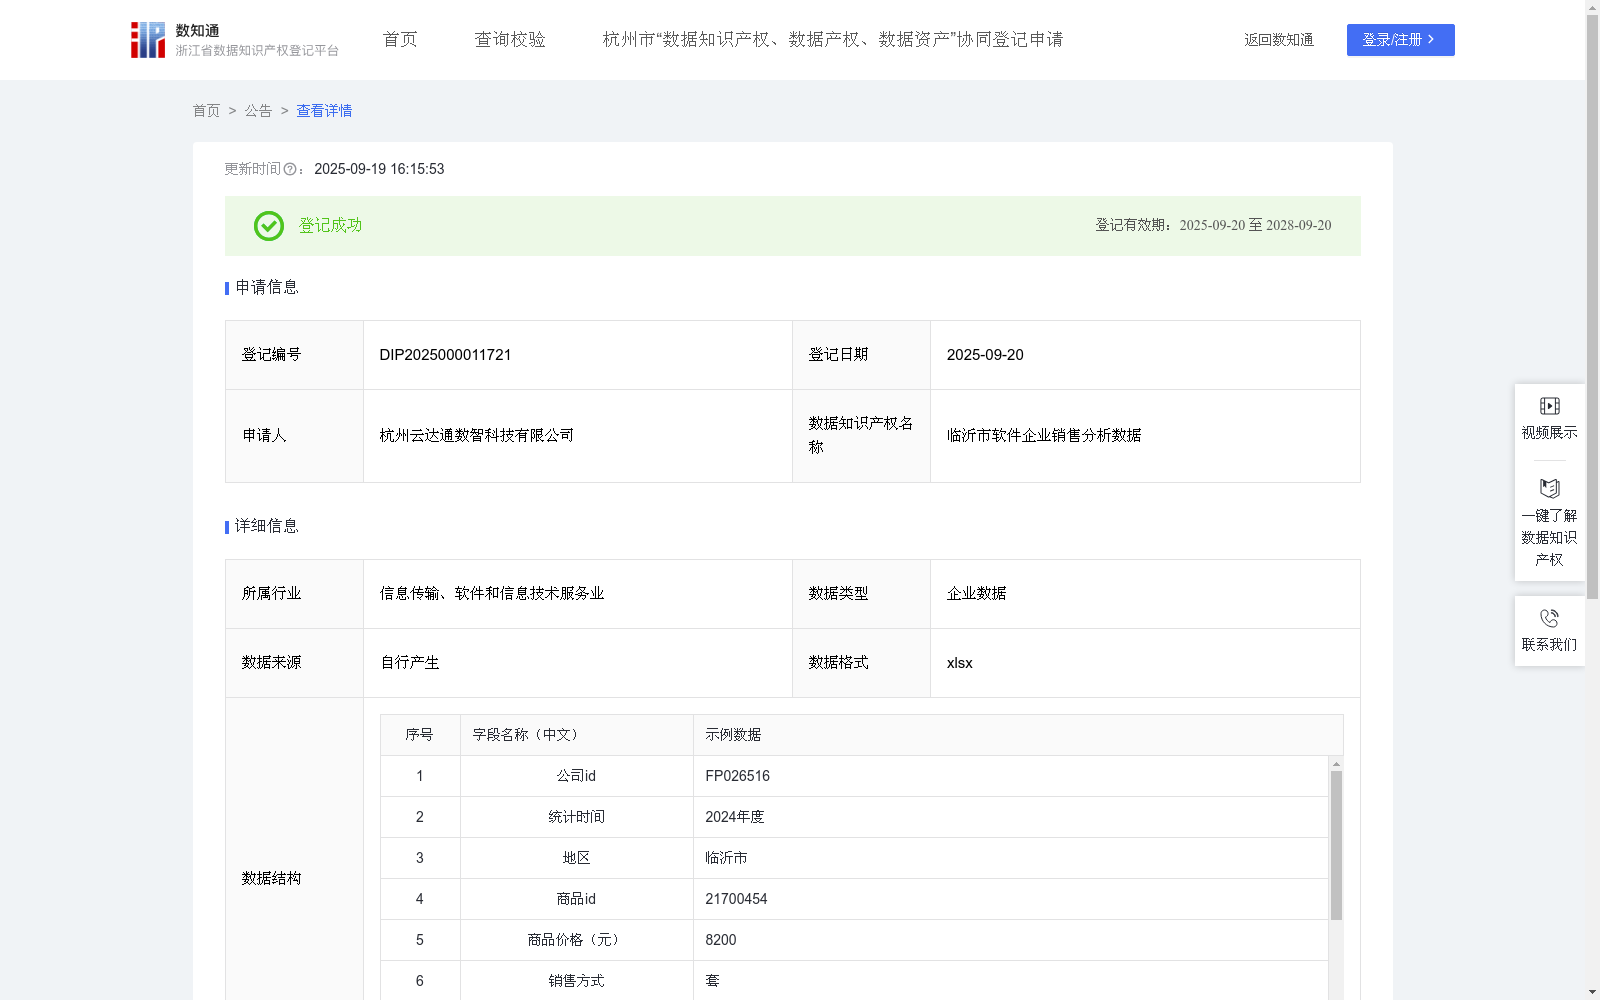
临沂市软件企业销售分析数据
收藏资源简介:
统计分析在临沂市合作企业的的经营数据,通过对历史合作企业经营情况,对企业进行分级制定,定位企业服务级别,为企业在临沂市各地有开发能力的企业,根据数据追踪企业经营服务情况,制定广告营销策略提供数据支持,从而帮助企业更准确地掌握市场动态,提升客户满意度和竞争力,为企业推送有开发需求的客户。1.数据采集:通过系统录入收集数据对地区在2024年度的软件开发、经营数据数据记录。2.数据处理:销售占比=某企业销售金额/销售总金额*100%;3.数据分类:企业销售占总消费的比例按从大到小进行排名。消费分类运用ABCDE分类法,对占比大于等于0.4%以上,给予“A类消费”分层;占比在小于0.4%到大于等于0.3%区间,则给予“B类消费”分层;占比在小于0.3%到大于等于0.2%区间,则给予“C类消费”分层;占比在小于0.2%到大于等于0.1%区间,则给予“D类消费”分层;占比在小于0.1%以下,则给予“E类消费”分层。4.数据应用:通过这样的分析流程,企业不仅能够更准确地把握市场动态,还能够有效提升客户满意度和市场竞争力。
This dataset conducts statistical analysis on the operational data of cooperative enterprises in Linyi City. Based on the historical operational status of these cooperative enterprises, it formulates enterprise grading standards to define their service levels. It provides data support for enterprises with development capabilities across various regions of Linyi City to track their operational service status and develop advertising and marketing strategies, thereby helping enterprises accurately grasp market trends, improve customer satisfaction and competitiveness, and deliver customers with development demands to relevant enterprises. 1. Data Collection: Collect and record the 2024 software development and operational data of the target region via system-based data entry. 2. Data Processing: The sales proportion is calculated using the formula: Sales Proportion = (Sales Amount of a Single Enterprise / Total Sales Amount) × 100%. 3. Data Classification: Rank enterprises in descending order based on their sales proportion of total consumption, then apply the ABCDE classification method for consumption tiering: enterprises with a proportion greater than or equal to 0.4% are categorized as "Class A Consumption"; those with a proportion between less than 0.4% and greater than or equal to 0.3% are categorized as "Class B Consumption"; those with a proportion between less than 0.3% and greater than or equal to 0.2% as "Class C Consumption"; those with a proportion between less than 0.2% and greater than or equal to 0.1% as "Class D Consumption"; and those with a proportion below 0.1% as "Class E Consumption". 4. Data Application: Through this analysis process, enterprises can not only accurately grasp market trends but also effectively improve customer satisfaction and market competitiveness.