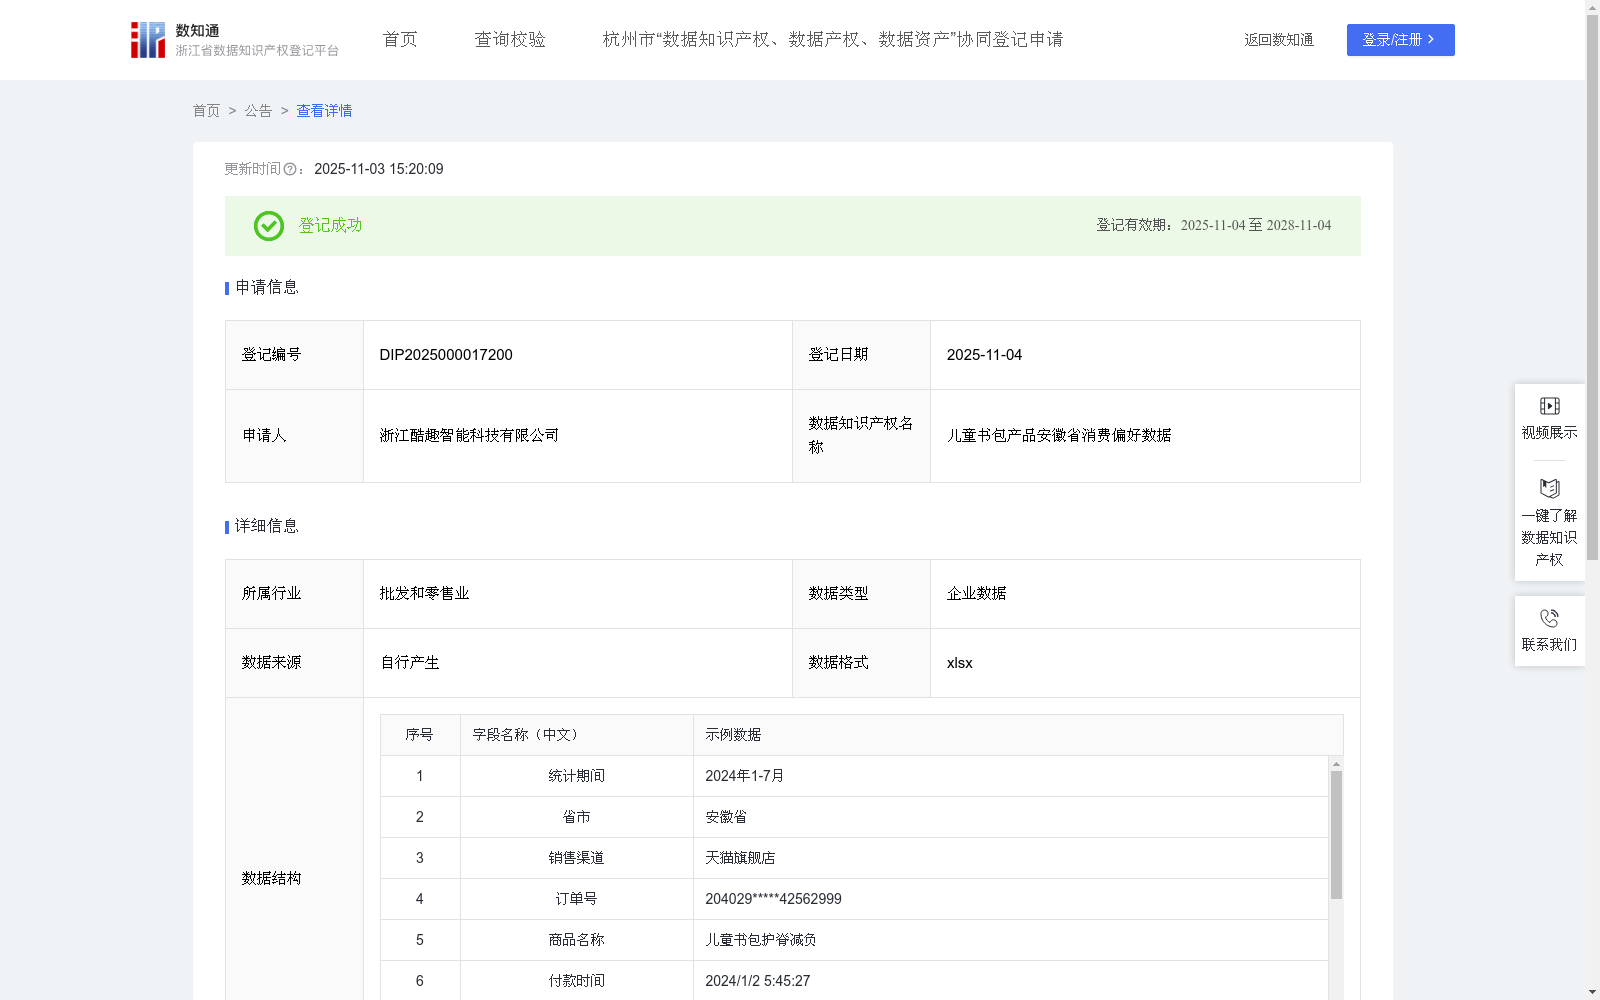
儿童书包产品安徽省消费偏好数据
收藏资源简介:
通过收集和分析全国范围内有对儿童书包产品交易行为的的相关消费数据,构建覆盖产品研发、精准营销、供应链优化的全链条智能决策体系结合当下“减压护脊”与“轻装便行”消费热点,深度解析各省份需求偏好与季节性特征,为生产企业提供动态产能规划依据,指导区域化差异备货,同时赋能零售终端实现个性化选品与场景化陈列,推动行业从传统备货模式向数据驱动的敏捷供应链转型,最大化释放母婴户外细分市场的增长潜力。1、数据采集:采集全国范围内,存在儿童书包产品消费行为的省份,相关销售交易数据。2、数据处理,对采集到的数据进行分类、梳理,便于分析使用。3、算法加工:将处理后的数据进行分析:全国平均销售金额=全国销售总额/全国销售总数量,某省偏好指数L=(某省销售总额/全国平均销售金额)*(全国销售总数量/全国销售总额),“全国销售总数量/全国销售总额”是常数,用于将算法确定为基于全国平均销售金额的需求量进行计算。数据为整理后状态,主要根据地区汇集,不完全按照时间先后顺序;订单可能存在捆绑/拼单/活动优惠,同品牌儿童书包产品单价在各区域、不同时间的差价忽略不计,因此全国销售总额/全国销售总数量≠某省销售总额/某省销售数量,依据行业经验采用全国平均销售金额进行标准化算法处理。4、数据分类分级复用:根据计算出的偏好指数,L>50记为高偏好省份,30<L≤50记为中偏好省份,30≥L记为低偏好省份,根据地区等级安排更精准的生产营销策略,例如:加大高偏好省份的铺货量等。
By collecting and analyzing relevant consumer data related to transaction behaviors of children's schoolbag products across the country, this study constructs an end-to-end intelligent decision-making system covering product R&D, precision marketing and supply chain optimization. Combining the current consumer hotspots of "pressure-relieving and spine-protecting" and "lightweight and easy-to-carry", it deeply analyzes the demand preferences and seasonal characteristics of each province, providing production enterprises with a basis for dynamic production capacity planning, guiding regional differentiated stocking, empowering retail terminals to achieve personalized product selection and scenario-based display, promoting the transformation of the industry from traditional stocking models to data-driven agile supply chains, and maximizing the growth potential of the mother and baby outdoor niche market. 1. Data Collection: Collect relevant sales transaction data from provinces across the country where there is consumer behavior for children's schoolbag products. 2. Data Processing: Classify and organize the collected data to facilitate analysis and utilization. 3. Algorithm Processing: Analyze the processed data as follows: National Average Sales Amount = National Total Sales Revenue / National Total Sales Volume; Provincial Preference Index L = (Provincial Total Sales Revenue / National Average Sales Amount) * (National Total Sales Volume / National Total Sales Revenue). Note that National Total Sales Volume / National Total Sales Revenue is a constant, which is used to standardize the algorithm based on the national average sales amount for demand calculation. The data is in a consolidated state, mainly aggregated by region, and not strictly sorted chronologically. Orders may involve bundling, group buying, or promotional offers, and price differences of the same-brand children's schoolbag products across regions and time periods are ignored. Therefore, National Total Sales Revenue / National Total Sales Volume ≠ Provincial Total Sales Revenue / Provincial Total Sales Volume. Standardized algorithm processing using the national average sales amount is adopted based on industry experience. 4. Data Classification, Grading and Reuse: According to the calculated preference index, provinces are categorized as high-preference provinces when L>50, medium-preference provinces when 30<L≤50, and low-preference provinces when L≤30. More precise production and marketing strategies are formulated based on the regional classification, such as increasing product distribution in high-preference provinces, etc.